
CB05-FF.06-2
April 29, 2005
Printable PDF
Version (83K) |
| |
|
|
|
|
|
|
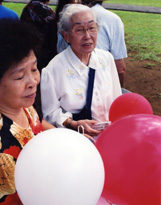
Asian/Pacific American Heritage
Month
May 2005
In 1978, a joint congressional resolution established Asian/Pacific American
Heritage Week. The first 10 days of May were chosen to coincide with two
important anniversaries: the arrival in the United States of the first
Japanese immigrants (May 7, 1843) and the completion of the transcontinental
railroad (May 10, 1869). In 1992, Congress expanded the 10-day observance
to a month-long celebration. Per a 1997 Office of Management and Budget
directive, the Asian or Pacific islander racial category was separated
into two different categories: “Asian” and “native Hawaiian
or other Pacific islander.” |
| Asians |
|  13.5
million 13.5
million
The estimated number of U.S. residents who say they are Asian
or Asian in combination with one or more other races. This group comprises
5 percent of the total population. California
has both the largest population (4.6 million) and the largest numerical
increase (367,100) of people of this group since April 2000; Hawaii is
the state where Asians make up the highest proportion of the total population
(58 percent).

Education
50%
The percentage of Asians, age 25 and over, who have a bachelor’s
degree or higher level of education. Asians have the highest proportion
of college graduates of any race or ethnic group in the country. The corresponding
rate for all adults in this age group is 27 percent.
88%
The percentage of Asians, age 25 and over, who are high
school graduates. The corresponding rate for all adults in this age
group is 85 percent.
19%
The percentage of Asians, age 25 and over, who have an advanced
degree (e.g., master’s, Ph.D., M.D. or J.D.). The corresponding
rate for all adults in the age group is 9 percent. |
Coming to America
8.7 million
The number of U.S. residents who were born
in Asia. Asian-born residents comprise one-fourth of the nation’s
total foreign-born population.
52%
The percentage of the foreign-born from Asia who are naturalized
U.S. citizens. The corresponding rate for the foreign-born population
as a whole is 38 percent.
1.7 million
The estimated number of foreign-born
people from China (Table: PCT027). Next to Mexico, China is the leading
country of birth for the nation’s foreign-born. Also among the top
10 countries of birth for the foreign-born population are the Philippines,
India, Vietnam and Korea. |
Serving Our Nation
276,000
The number of Asian-American
military veterans (Table: P056D). |
Age Distribution
Twenty-six percent of people identifying themselves as either Asian
or Asian in combination with one or more other races [PDF] are under
18; 8 percent are 65 or over. |
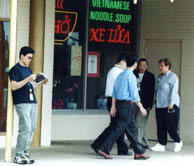
Languages
2.2 million
The number of people
who speak Chinese at home (Table: P034). Next to Spanish, Chinese is
the most widely spoken non-English language in the country. Also among the
top 10 most frequently spoken languages are: Tagalog (1.3 million); Vietnamese
(1.1 million); and Korean (966,959). |
Counties
1.3 million
The number of Asians
in Los Angeles County, Calif., which tops the nation’s counties.
This county also experienced the largest numerical increase of Asians (76,700)
from 2000 to 2003. |
| |
|
| Native Hawaiians
and Other Pacific Islanders |
| 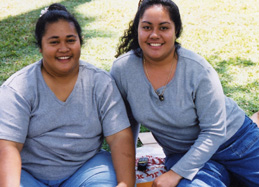 959,603 959,603
The estimated number of U.S. residents who say they are native
Hawaiian and other Pacific islander or native Hawaiian and other Pacific
islander in combination with one or more other races. This group comprises
0.3 percent of the total population. There are 282,500 native Hawaiians
or Pacific islanders in Hawaii,
which leads all states. Hawaii is also where native Hawaiians and other
Pacific islanders make up the largest proportion (23 percent) of the total
population. California had the largest numerical increase of native Hawaiians
and other Pacific islanders (12,700) since April 2000.
Serving Our Nation
There are 25,000 veterans
who are of native Hawaiian and other Pacific islander heritage (Table:
P056E).
Languages
27,160
The number of people
who speak Hawaiian at home.
|
Education
16%
The percentage of native Hawaiians and other Pacific islanders, age 25 and
older, who have at
least a bachelor’s degree (Table: PCT035E).
82%
The percentage of native Hawaiians and other Pacific Islanders, age 25
and older, who are high
school graduates (Table: PCT035E).
4%
The percentage of native Hawaiians and other Pacific islanders, age 25
and older, who have obtained a graduate
degree (Table: PCT035E). |
Counties
186,200
The number of native
Hawaiians and other Pacific islanders who live in Honolulu County, Hawaii,
which has the largest population of this race of any county in the nation.
Bronx County, N.Y., registered the largest numerical increase of native
Hawaiians and other Pacific islanders (4,100) between 2000 and 2003. |
Age Distribution
33%
The percentage of the
native Hawaiian and other Pacific islander population [PDF] that is
under 18; 5 percent are 65 or over. |
| Following is a list
of observances typically covered by the Census Bureau Facts
for Features series: |
- Martin Luther King, Jr. Day (Jan. 17) & African-American History
Month (February)
- Valentine's Day (Feb. 14)
- Women's History Month (March)
- Irish-American Heritage Month (March)/
St. Patrick's Day (March 17)
- Asian Pacific American Heritage Month (May)
- Older Americans Month (May)
- Mother's Day (May 8)
- Father's Day (June 19)
- The Fourth of July (July 4)
- Anniversary of Americans With Disabilities Act (July 26)
|
- Back to School (August)
- Labor Day (Sept. 5)
- Grandparents Day (Sept. 11)
- Hispanic Heritage Month
(Sept. 15-Oct. 15)
- Halloween (Oct. 31)
- American Indian/Alaska Native Heritage
Month (November)
- Veterans Day (Nov. 11)
- Thanksgiving Day (Nov. 24)
- The Holiday Season (December)
|
Individual source links for
each statement herein may be accessed on the Internet at
<http://www.census.gov/Press-Release/www/releases/archives/facts_for_features_special_editions/004522.html>.
The photos
herein may be downloaded and are available free for your use in all
print and broadcast products.
Please credit the U.S. Census Bureau. For product information, call (301)
763-3011 or e-mail <pio.broadcast.services@census.gov>.
Editor’s note: Some of the preceding data were
collected in surveys and, therefore, are subject to sampling error. Questions
or comments should be directed to the Census Bureau’s Public Information
Office at (301) 763-3030; fax (301) 457-3670; or e-mail <pio@census.gov>.
|
