

Images & Animations
-
Credit
MODIS Science Team
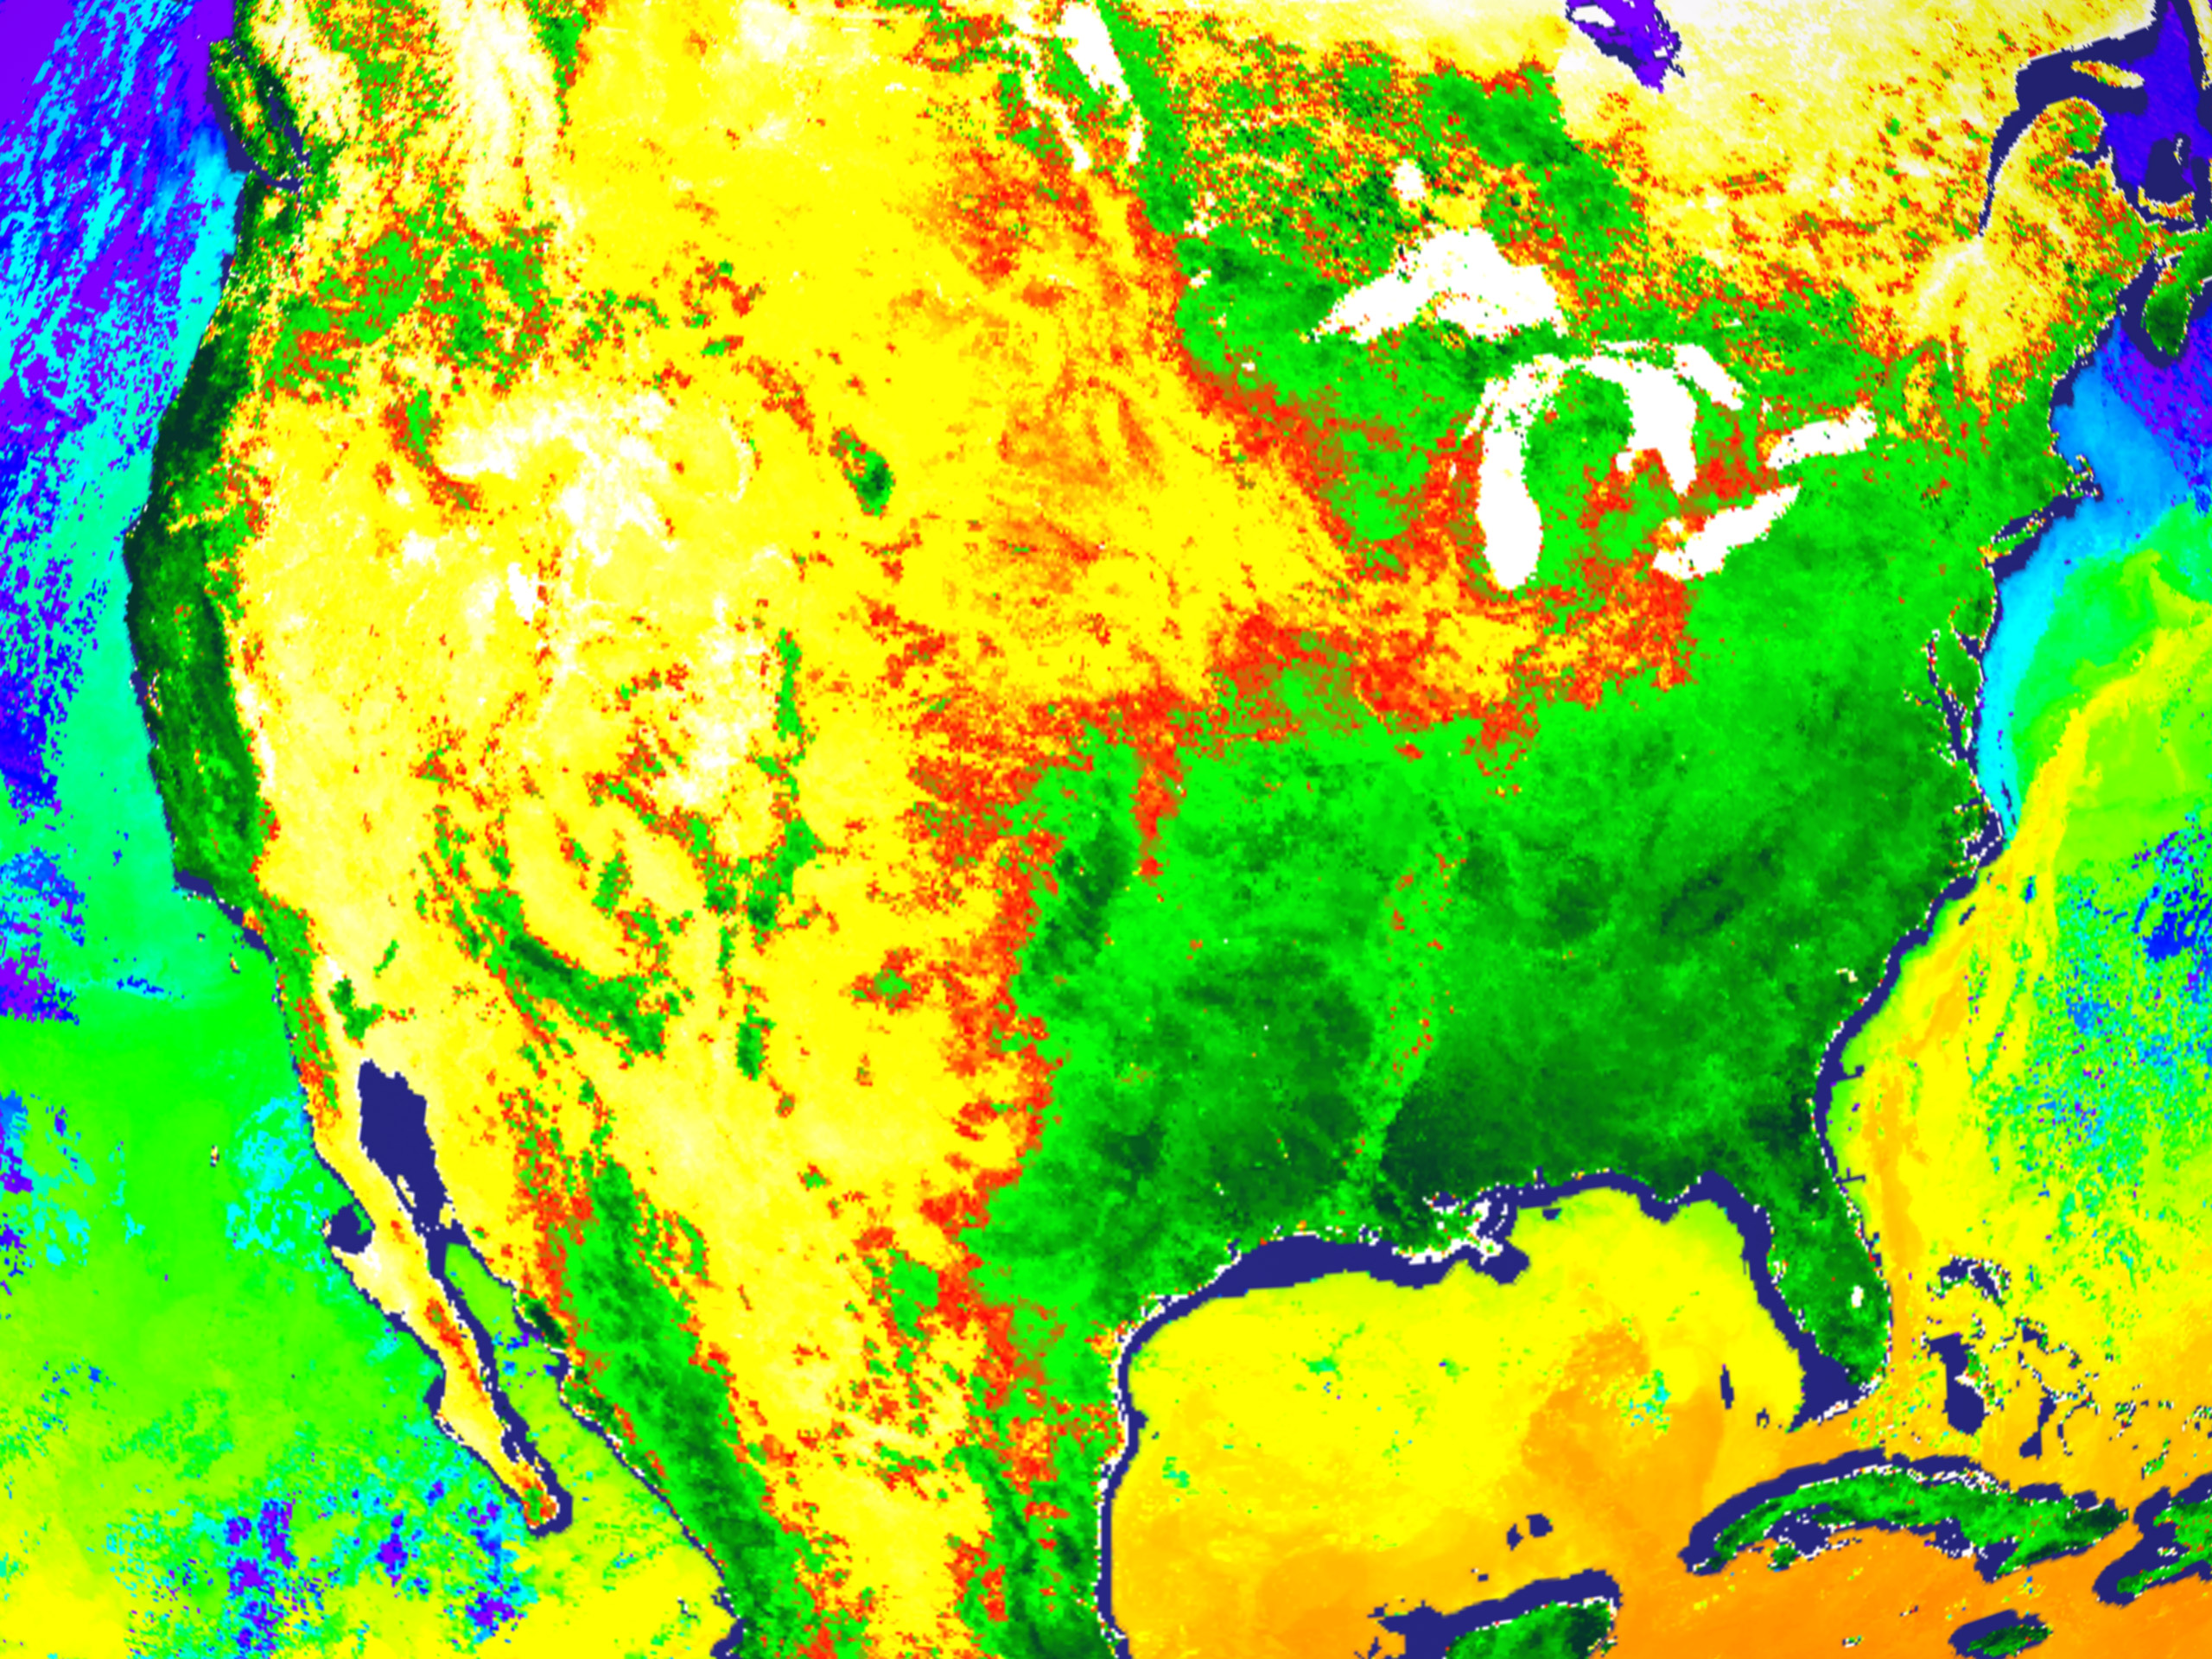
This is a composite MODIS image showing the "green wave" of spring in North America and sea surface temperature in the ocean, collected over an 8-day period during the first week in April 2000. On land, the darker green pixels show where the most green foliage is being produced due to photosynthetic activity. Yellows on land show where there is little or no productivity and red is a boundary zone. In the ocean, orange and yellows show warmer waters and blues show colder values.
(MODIS Data Type: MODIS-PFM)
Metadata
-
Sensor
Terra/MODIS -
Visualization Date
2000-05-09