Maps
The DMIS Incident Maps are very robust and allow distributed users to plot and share information in real time. Users can establish their own layers and place icons on the map which represent their individual response to a given situation.
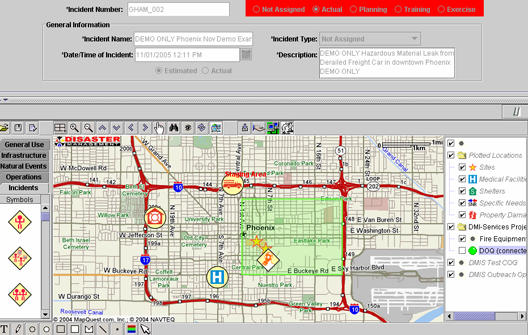
This graphic represents a street level view of plotted incident information, allowing users to identify specific structures related to the site. The column to the right of the map is a listing of the different layers associated with this map. Additional layers may be added through access to publicly available Web Map Services (WMS).