Promote health for all through a healthy environment.
According to the World Health Organization, “In its broadest sense, environmental
health comprises those aspects of human health, disease, and injury that are
determined or influenced by factors in the environment. This includes the study
of both the direct pathological effects of various chemical, physical, and
biological agents, as well as the effects on health of the broad physical and
social environment, which includes housing, urban development, land-use and
transportation, industry, and agriculture.”[1]
The term “environment” also may be used to refer to air, water, and soil. This
more narrow definition ignores the manmade environment created by a society.
Where and how a society chooses to grow and develop affects the quality of life
by determining how long people spend traveling to work, shopping, or going to
school. Where and how a society builds its houses, schools, parks, and roadways
can also limit the ability of some people to move about and lead a normal life.
Because the impact of the environment on human health is so
great, protecting the environment has long been a mainstay of public health
practice. National, State, and local efforts to ensure clean air and safe
supplies of food and water, to manage sewage and municipal wastes, and to
control or eliminate vector-borne illnesses have contributed a great deal to
improvements in public health in the United States. Unfortunately, in spite of
the billions of dollars spent to manage and clean up hazardous waste sites in
the Nation each year, little money has been spent evaluating the health risks
associated with chronic, low-level exposures to hazardous substances. This
imbalance results in an inadequate amount of useful information to evaluate and
manage these sites effectively and to evaluate the health status of people who
live near the sites.[2] In the past,
research in environmental epidemiology and toxicology has often been based on
limited information. New knowledge about the interactions between specific
genetic variations among individuals and specific environmental factors
provides enormous opportunity for further developing modifications in
environmental exposures that contribute to disease. Further research is needed
to address these and other problems and to improve the science and management
of health effects on people exposed to environmental hazards.[3]
Environmental factors play a central role in human
development, health, and disease. Broadly defined, the environment, including
infectious agents, is one of three primary factors that affect human health.
The other two are genetic factors and personal behavior.
Human exposures to hazardous agents in the air, water, soil,
and food and to physical hazards in the environment are major contributors to
illness, disability, and death worldwide. Furthermore, deterioration of
environmental conditions in many parts of the world slows sustainable
development. Poor environmental quality is estimated to be directly responsible
for approximately 25 percent of all preventable ill health in the world, with
diarrheal diseases and respiratory infections heading the list.[4]
Ill health resulting from poor environmental quality varies considerably among
countries. Poor environmental quality has its greatest impact on people whose
health status already may be at risk.
Because the effect of the environment on human health is so
great, protecting the environment has been a mainstay of public health practice
since 1878.[5]
National, Tribal, State, and local efforts to ensure clean air and safe
supplies of food and water, to manage sewage and municipal wastes, and to control
or eliminate vector-borne illnesses have contributed significantly to
improvements in public health in the United States. However, the public’s
awareness of the environment’s role in health is more recent. Publication of
Rachel Carson’s Silent Spring in the early 1960s, followed by the
well-publicized poor health of residents of Love Canal in western New York, a
significant toxic waste site, awakened public consciousness to environmental
issues. The result of these and other similar events is the so-called
environmental movement that has led to the introduction into everyday life of
such terms as Superfund sites, water quality, clean air, ozone, urban sprawl,
and agricultural runoff.
In 1993 alone, over $109 billion was spent on pollution
abatement and control in the United States.[6]
However, many hazardous sites still remain. Minimal research has been done to
evaluate the health risks associated with chronic low-level exposures to
hazardous substances, resulting in an inability to evaluate and manage such
sites effectively and to evaluate the health status of residents living near
such sites. Further environmental epidemiology and toxicology research is
needed to address such problems and to improve the science and public health
management of the health effects on people exposed to environmental hazards.
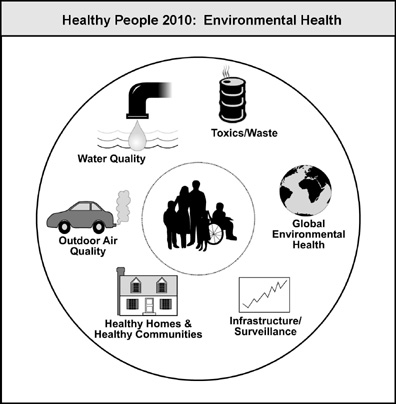
To address the broad range of human health issues affected
by the environment, this chapter discusses six topics: outdoor air quality,
water quality, toxics and waste, healthy homes and healthy communities, infrastructure
and surveillance, and global environmental health issues.
Outdoor air quality. Air pollution continues to be a
widespread public health and environmental problem in the United States,
causing premature death, cancer, and long-term damage to respiratory and
cardiovascular systems. Air pollution also reduces visibility, damages crops
and buildings, and deposits pollutants on the soil and in bodies of water where
they affect the chemistry of the water and the organisms living there.
Approximately 113 million people live in U.S. areas designated as nonattainment
areas by the U.S. Environmental Protection Agency (EPA) for one or more of the
six commonly found air pollutants for which the Federal Government has established
health-based standards.[7] The problem of air pollution is
national—even international—in scope. Most of the U.S. population lives in
expanding urban areas where air pollution crosses local and State lines and, in
some cases, crosses U.S. borders with Canada and Mexico.[8], [9]
Although some progress toward reducing unhealthy air
emissions has been made, a substantial air pollution problem remains, with
millions of tons of toxic air pollutants released into the air each year.[10]
The presence of unacceptable levels of ground-level ozone is the largest
problem, as determined by the number of people affected and the number of areas
not meeting Federal standards.
Motor vehicles account for approximately one-fourth of
emissions that produce ozone and one-third of nitrogen oxide emissions. Particulate
and sulfur dioxide emissions from motor vehicles represent approximately 20
percent and 4 percent, respectively. Some 76.6 percent of carbon monoxide
emissions are produced each year by transportation sources (for example, motor
vehicles).7
Unhealthy air is expensive. The estimated annual health
costs of human exposure to all outdoor air pollutants from all sources range
from $40 billion to $50 billion, with an associated 50,000 premature deaths.[11]
Water quality. Providing drinking water free of
disease-causing agents, whether biological or chemical, is the primary goal of
all water supply systems. During the first half of the 20th century the causes
for most waterborne disease outbreaks were bacteria; beginning in the 1970s
protozoa and chemicals became the dominant causes.[12]
Most outbreaks involve only a few individuals.[13], [14], [15] In 1993, however, more than 403,000
people became sick during a single episode of water-borne cryptosporidiosis.15
One problem in evaluating the relationship between drinking
water and infectious diseases is the lack of adequate technology to detect
parasitic contamination and to determine whether the organisms detected are
alive and infectious. The development of new molecular technologies to detect
and monitor water contamination will enhance water quality monitoring and
surveillance.
Contamination of water can come from both point (for
example, industrial sites) and nonpoint (for example, agricultural runoff)
sources. Biological and chemical contamination significantly reduces the value
of surface waters (streams, lakes, and estuaries) for fishing, swimming, and
other recreational activities. For example, during the summer of 1997, blooms
of Pfiesteria piscicida were implicated as the likely cause of fish
kills in North Carolina and Maryland. The development of intensive animal
feeding operations has worsened the discharge of improperly or inadequately
treated wastes,[16] which
presents an increased health threat in waters used either for recreation or for
producing fish and shellfish.
Toxics and waste. Critical information on the levels
of exposure to hazardous substances in the environment and their associated
health effects often is lacking. As a result, efficient health-outcome measures
of progress in eliminating health hazards in the environment are unavailable.
The identification of toxic substances and waste, whether hazardous,
industrial, or municipal, that pose an environmental health risk represents a
significant achievement in itself. Public health strategies are aimed at
tracking the Nation’s success in eliminating these substances or minimizing
their effects.
Toxic and hazardous substances, including low-level
radioactive wastes, deposited on land often are carried far from their sources
by air, groundwater, and surface water runoff into streams, lakes, and rivers
where they can accumulate in the sediments beneath the waters. Ultimate
decisions about the cleanup and management of these sites must be made keeping
public health concerns in mind.
The introduction and widespread use of pesticides in the
American landscape continues in agricultural, commercial, recreational, and
home settings. As a result, these often very toxic substances pose a potential
threat to people using them, especially if they are handled, mixed, or applied
inappropriately or excessively. Furthermore, children are at increased risk for
pesticide poisoning because of their smaller size and because pesticides may be
stored improperly or applied to surfaces that are more readily accessible by
children.
Healthy homes and communities. The public’s health,
particularly its environmental health, depends on the interaction of many
factors. To provide a healthy environment within the Nation’s communities, the
places people spend the most time—their homes, schools, and offices—must be
considered. Potential risks include indoor air pollution; inadequate heating, cooling, and sanitation;
structural problems; electrical and fire hazards; and lead-based paint hazards.
More than 6 million housing units across the country meet the Federal
Government’s definition of substandard housing.[17]
Many factors—including air quality; lead-based paint on
walls, trim, floors, ceilings, etc.; and hazardous household substances such as
cleaning products and pesticides—can affect health and safety. In 1996, the
American Association of Poison Control Centers reported more than 2 million
poison exposures from 67 participating poison control centers. The site of
exposure was a residence in 91 percent of cases.[18]
Infrastructure
and surveillance.Preventing
health problems caused by environmental hazards requires: (1) having enough
personnel and resources to investigate and respond to diseases and injuries
potentially caused by environmental hazards; (2) monitoring the population and
its environment to detect hazards, exposure of the public and individuals to
hazards, and diseases potentially caused by these hazards; (3) monitoring the
population and its environment to assess the effectiveness of prevention
programs; (4) educating the public and select populations on the relationship
between health and the environment; (5) ensuring that laws, regulations, and
practices protect the public and the environment from hazardous agents; (6)
providing public access to understandable and useful information on hazards and
their sources, distribution, and health effects; (7) coordinating the efforts
of government agencies and nongovernmental groups responsible for environmental
health; and (8) providing adequate resources to accomplish these tasks.
Development of additional methods to measure environmental hazards in people
will permit more careful assessments of exposures and health effects.
Global environmental health. Increased international
travel and improvements in telecommunications and computer technology are
making the world a smaller place. The term “global community” has real
significance, as shared resources—air, water, and soil—draw people together.
Actions in every country affect the environment and influence events around the
world. Undoubtedly, the environment affects everyone’s health. Sometimes
benefits in one area inadvertently create worse conditions for people in
different areas of the world. For example, in 1996, the United States exported
more than $2.5 billion worth of pesticides.[19]
Exported pesticides that are not registered, or pesticides that are restricted
for use in the United States, are often used by developing countries. Their use
not only endangers populations in those countries but also can contaminate food
being exported from those countries to the United States. Sensitive populations,
such as children and pregnant women, may be at risk from these environmental
exposures. The United States can contribute to improving the health of people
internationally, not only as part of a shared goal for humanity, but also
because a healthy global population has positive social and economic benefits
throughout the world.
Additionally, a number of countries have resources available
to protect their populations from adverse health impacts, but because of
inadequate information they are unable to do so. Lead abatement technology, for
example, is one area where the United States can provide information to other
countries. Likewise, consultation and assistance on numerous environmental
health issues from lead poisoning to disaster preparedness will help reduce
illness, disability, and death in countries with these problems, which can lead
to a healthier global community.
The Nation should expand its efforts for improving
environmental conditions to enhance the health of developing countries. It should also increase collaboration,
coordination, and outreach efforts with the rest of the world to help close the
gap between existing and attainable health status.
During the 1990s, progress in improving environmental health
was mixed. The decline in childhood lead poisoning in the United States
represents a public health success. In 1984, between 2 million and 3 million
children aged 6 months to 5 years had blood lead levels (BLLs) greater than 15
µg/dL, and almost a quarter of a million had BLLs above 25 µg/dL,[20]
a level that can affect vital organs and the brain. (Blood levels are measured
in micrograms of lead found in a deciliter of blood.) By the early 1990s, fewer
than 900,000 children had BLLs above 10µg/dL,the current standard for identifying children
at risk.[21]
This dramatic reduction is the result of research to identify persons at risk,
professional and public education campaigns to “spread the word,” broad-based
screening measures to find those at risk, and effective community efforts to
clean up problem areas, namely, substandard housing units. However, despite the
success achieved, more remains to be done before childhood lead poisoning
becomes a disease of the past. Although childhood lead poisoning occurred in
all population groups, the risk was higher for persons having low income,
living in older housing, and belonging to certain racial and ethnic groups. For
example, among non-Hispanic black children living in homes built before 1946,
22 percent had elevated BBLs. Because the risk for lead poisoning is not spread
evenly throughout the population, efforts are continuing to identify children
at risk and ensure that they receive preventive interventions.[22]
Unfortunately, not all trends for environmental health
issues are as encouraging. Since the mid-1980s, asthma rates in the United
States have risen to the level of an epidemic.[23] Asthma and other respiratory
conditions often are triggered or worsened by substances found in the air, such
as tobacco smoke, ozone, and other particles or chemicals. Based on existing
data, an estimated 14.9 million people in the United States had asthma in 1995,[24]
including more than 5 million children aged 17 years and under.[25]
Between 1980 and 1993, the overall death rate for asthma increased 57 percent,
from 12.8 to 20.1 deaths per million population;23
for people aged 17 years and under, the death rate increased 67 percent, from
1.8 to 3.0 deaths per million population.[26]
The direct economic and health care costs of asthma and other respiratory
conditions can be large. In 1990, the estimated total cost of asthma was $6.2
billion; the total cost was projected to rise to $14.5 billion by the year
2000.[27] The indirect costs of asthma,
measured in reduced quality of life and lost productivity, include the
estimated 10 million school days each year that children miss. Lost
productivity from missed work days of parents caring for children with asthma
is estimated to be $1 billion—not including the cost of lost productivity from
adults with asthma who miss work.27
(See Focus Area 24. Respiratory Diseases.)
Although successes in environmental public health are
possible, they are difficult to achieve. Infectious and chemical agents still
contaminate food and water. Animals continue to carry diseases to human
populations, and outbreaks of once-common intestinal diseases (for example,
typhoid fever), although less frequent, still occur. (See Focus Area 10. Food
Safety.) These outbreaks underscore the need to maintain and improve programs
developed in the first half of the 20th century to ensure the safety of food
and water. The challenge is to retain these basic capacities in the 21st
century, with the added responsibilities for dealing with emerging hazards. The
control of well-known hazards must coexist with ongoing research and the
development of strategies and methods to understand and control new hazards.
Another challenge is the need to help the public understand the link between
human activity and the destruction of the environment.
Within the United States, significant strides toward a
reduction in harmful air emissions can be achieved by individuals choosing not
to drive their cars. People need to use public transit, walk, or bicycle more
often. Laws can help improve street and highway design to facilitate
pedestrians and bicyclists, and employers can embrace telecommuting, but the
choice remains with the individual. Encouraging individuals to walk or bike
also may play a role in reducing the problems of obesity and overweight
individuals, which have risen to alarming levels in the U.S. population.
Urban sprawl has become an increasingly important concern in
the United States for several reasons: increased outdoor air pollution in major
urban areas, reduced quality of life due to the loss of free time and the
stress of increased commuting time, and less green space in major metropolitan
areas. Between 1983 and 1995, the average annual vehicle miles traveled
increased 80 percent.[28]
These conditions lead to negative health conditions, such as asthma and
injuries from road rage due to traffic-related stress.[29]
In addition, sprawl diminishes the amount of land available for prime
recreational and agricultural uses and can bring two land uses together that do
not coexist well. For example, a residential development in an area that was
previously agricultural may expose residents to environmental hazards, such as
pesticides, which may pose a threat to their health.
On a global scale, the U.S.-Mexico border area illustrates
how human activity can contribute to damaging the environment, affecting
generations to come. Over the past 30 years, this region has experienced a dramatic
surge in population and industrialization. The region has had great difficulty
in supporting this growth and suffers from a lack of resources and expertise to
manage solid waste properly, handle and store pesticides and other hazardous
materials, supply sufficient drinking water, and support other sustainable
development efforts.8
Nations need to make choices about how to deal with such regions; offering
technical assistance is an option to speed knowledge transfer and reduce
environmental harm.
Studies have linked race and socioeconomic status to
increased exposure to environmental hazards, and information about
gene-environment interactions improves the ability to determine who has
increased risk of disease from these exposures. Table 8-A and Table 8-Bsummarize
some inequities in the United States regarding exposure to selected potential
environmental hazards.
|
Table
8-A. Proportions of African
American, Hispanic, and white
populations living in air-quality nonattainment areas, 1992.[30]
|
|
Pollutant
|
Demographic Breakdowns
|
|
African
Americans
|
Hispanics
|
Whites
|
|
Percent Living in Air-Quality Nonattainment Areas
|
|
Particulates
|
16.5
|
34.0
|
14.7
|
|
Carbon monoxide
|
46.0
|
57.1
|
33.6
|
|
Ozone
|
62.2
|
71.2
|
52.5
|
|
Sulfur dioxide
|
12.1
|
5.7
|
7.0
|
|
Lead
|
9.2
|
18.5
|
6.0
|
|
Table
8-B. Proportions of certain
racial and ethnic and lower socioeconomic populations in census tracts
surrounding waste treatment, storage, and disposal facilities (TSDF)
compared with the proportions of these groups in other census tracts, 1994.30
|
|
Demographic Breakdowns
|
|
Location of TSDFs
|
African
Americans
|
Hispanics
|
Persons Living
Below the
Poverty Line
|
|
Percent
|
|
Census tracts with either TSDFs or at
least 50 percent of their area within 2.5 miles of a tract with TSDF
|
24.7
|
10.7
|
19.0
|
|
Census tracts without TSDFs
|
13.6
|
7.3
|
13.1
|
|
|
|
|
|
Disparities
exist in the environmental exposures certain populations face and in the health
status of these populations. For example, in New York City, African American,
Hispanic, and low-income populations have been found to have hospitalization and death rates from asthma three to five times higher than
those for all New York City residents. African American children have been
found to be three times more likely than white children to be hospitalized for
asthma and asthma-related conditions and four to six times more likely to die
from asthma.30
(See Focus Area 24. Respiratory Diseases.) With respect to BLL, children from
certain racial and ethnic groups are disproportionately affected. While there
are no studies to show rural and frontier dwellers are at increased risk to
exposure to contaminated drinking water, the preponderance of this population
depends on unregulated private wells for their drinking water. The U.S.
Geological Survey (USGS) reports that 42.8 million persons in the United States
(17 percent of the total population) were served by their own (self-supplied)
water systems in 1990.[31]
An
increase in public awareness of environmental health issues is key to achieving
this chapter’s goal and objectives. Education—at all levels—is a cornerstone of
broad prevention efforts.
Improving
the availability of environmental health data also will help meet the objectives.
The Internet has increased dramatically access to environmental information.
Databases such as TOXNET (at http://toxnet.nlm.nih.gov/),[32]
Internet Grateful Med (at http://igm.nlm.nih.gov),[33]
and TRI (the Toxics Release Inventory www.epa.gov/ceisweb1/ceishome/ceisdata/xplor-tri/explorer.htm)
may provide useful information about environmental hazards or other
environmental problems in communities to health care providers, policymakers,
and the public. Moreover, better dissemination of global environmental health
information may reduce the occurrence of disease or exposure to harmful
environmental agents for U.S. citizens traveling abroad.
To
be successful, programs to improve environmental health must be based on
scientific evidence. The complex relationship between human health and the
acute and long-term effects of environmental exposures must be studied so
prevention measures can be developed. Surveillance systems to track exposures
to toxic substances such as commonly used pesticides and heavy metals must be
developed and maintained. To the extent possible, these systems should use
biomonitoring data, which provide measurements of toxic substances in the human
body. A mechanism is needed for tracking the export of pesticides restricted or
not registered for use in the United States.
Environmental
hazards are not limited by political boundaries. The scope of public and
environmental health must be global if the Nation is to achieve good health for
all persons in the United States. A global scope will help develop and achieve
effective ways to prevent disease worldwide as well. The United States must
work with other governments, nongovernmental organizations, and international organizations
to help improve human health on a global scale.
Healthy
People 2000 targets have been met for objectives dealing with outbreaks of
waterborne diseases, with solid wastes, and with toxic substances released
through industrial processes. Substantial progress has been made in objectives
involving the proportion of people who live in counties that meet EPA air standards
for air pollution, the number of States that require radon disclosures with
real estate transactions, and the recycling of household hazardous waste. More
moderate progress has taken place for the objectives involving radon and
lead-based paint testing in homes, asthma hospitalizations, and States with
laws to track environmental diseases. Mixed progress or movement away from the
targets is being seen in objectives dealing with mental retardation and impaired
surface waters (rivers, lakes, and estuaries). Data have been mixed or difficult
to assess for the cleanup of hazardous waste sites. The target for blood lead
levels in children has not been met, though some progress has been made.
Note: Unless otherwise
noted, data are from the Centers for Disease Control and Prevention, National Center for Health Statistics, Healthy People 2000
Review, 1998–99.
Environmental Health
Goal: Promote health for all through a healthy
environment.
|
Number
|
Objective Short Title
|
|
Outdoor Air Quality
|
|
8-1
|
Harmful air
pollutants
|
|
8-2
|
Alternative modes of transportation
|
|
8-3
|
Cleaner alternative fuels
|
|
8-4
|
Airborne toxins
|
|
Water Quality
|
|
8-5
|
Safe drinking water
|
|
8-6
|
Waterborne disease outbreaks
|
|
8-7
|
Water conservation
|
|
8-8
|
Surface water health risks
|
|
8-9
|
Beach closings
|
|
8-10
|
Fish contamination
|
|
Toxics and Waste
|
|
8-11
|
Elevated blood lead levels in
children
|
|
8-12
|
Risks posed by hazardous sites
|
|
8-13
|
Pesticide
exposures
|
|
8-14
|
Toxic pollutants
|
|
8-15
|
Recycled municipal solid waste
|
|
Healthy Homes and Healthy Communities
|
|
8-16
|
Indoor allergens
|
|
8-17
|
Office building air quality
|
|
8-18
|
Homes tested for radon
|
|
8-19
|
Radon-resistant new home construction
|
|
8-20
|
School policies to protect against
environmental hazards
|
|
8-21
|
Disaster preparedness plans and
protocols
|
|
8-22
|
Lead-based paint testing
|
|
8-23
|
Substandard housing
|
|
Infrastructure and Surveillance
|
|
8-24
|
Exposure to pesticides
|
|
8-25
|
Exposure to heavy metals and other
toxic chemicals
|
|
8-26
|
Information systems used for
environmental health
|
|
8-27
|
Monitoring environmentally related
diseases
|
|
8-28
|
Local agencies using surveillance
data for vector control
|
|
Global Environmental Health
|
|
8-29
|
Global burden of disease
|
|
8-30
|
Water quality in the U.S.–Mexico
border region
|
Target and baseline:
|
Objective
|
Reduction in Air
Pollutants
|
1997 Baseline
|
2010 Target
|
|
|
|
Percent
|
|
8-1a.
|
Ozone*
|
43
|
0
|
|
8-1b.
|
Particulate matter*
|
12
|
0
|
|
8-1c.
|
Carbon
monoxide
|
19
|
0
|
|
8-1d.
|
Nitrogen dioxide
|
5
|
0
|
|
8-1e.
|
Sulfur dioxide
|
2
|
0
|
|
8-1f.
|
Lead
|
<1
|
0
|
|
|
|
Number
|
|
8-1g.
|
Total number of people
|
119,803,000
|
0
|
*The targets of zero percent for ozone and particulate
matter are set for 2012 and 2018, respectively.
Target setting
method: Consistent with the Clean Air Act (Public Law 101-549).
Data source:
Aerometric Information Retrieval System (AIRS), EPA, OAR.
Note: For the purpose of this objective, EPA is counting
persons living in nonattainment areas only.
Data for population groups currently are not analyzed. |
Historically,
EPA’s air quality monitoring and National Ambient Air Quality Standards data
collection have taken place in large urban centers and other areas generally
considered to have the Nation’s poorest air quality. As nonattainment areas
become attainment areas, EPA will continue its monitoring efforts. (See Focus Area 24. Respiratory Diseases.)
Target and baseline:
|
Objective
|
Increase in Use of
Alternative Modes of Transportation
|
1995
Baseline
|
2010
Target
|
Percent
|
|
8-2a.
|
Trips made by bicycling
|
0.9
|
1.8
|
|
8-2b.
|
Trips made by walking
|
5.4
|
10.8
|
|
8-2c.
|
Trips made by transit
|
1.8
|
3.6
|
|
8-2d.
|
Persons who telecommute
|
Developmental
|
Target setting
method: Consistent with the goal of the National Bicycling and Walking
Study, U.S. Department of Transportation (DOT).
Data source:
Nationwide Personal Transportation Survey (NPTS), U.S. Department of
Transportation.
For
many communities in the United States, motor vehicle emissions are the primary
cause of air pollution. Increasing use of alternative modes of transportation
is a comprehensive approach that each citizen can take to affect local levels
of air pollution. An increase in neighborhood streets with ways to slow traffic
and with more sidewalks and bike lanes, offroad pedestrian or bike routes, and
bicycle and pedestrian plans and programs will aid in reaching the targets for
biking, walking, and transit objectives. (See Focus Area 22. Physical Activity
and Fitness.) As technology improves, telecommuting will play an increasing
role in U.S. business. Many people will be able to do some or all of their work
from home, thus reducing peak-period demand for transportation.
Target: 30
percent.
Baseline: Cleaner
alternative fuels represented 2.7 percent of U.S. motor fuel consumption in
1997.
Target setting
method: 10-fold improvement.
Data source:
Alternatives to Traditional Transportation Fuels, U.S. Department of Energy,
Energy Information Administration.
Privately
owned cars, vans, and trucks; commercial fleets, trucks, and buses; and power
plants are the major users of alternative fuels. Ethanol-blended fuels have
been used in small engines and other nonautomotive gasoline engines since the
fuels first came into the marketplace over 25 years ago. Today, all mainstream
manufacturers of power equipment, motorcycles, snowmobiles, and outboard motors
permit the use of ethanol blends in their products.
The
primary force behind development of an alternative fuels infrastructure is the
U.S. Department of Energy Clean Cities Program—a voluntary program and locally
based government and industry partnership designed to promote the use of
alternative fuels and alternative fuel vehicles, cleaner air in major U.S.
cities, reduced dependence on imported oil, and stimulate local economic
activity.[34]
Infrastructure
building also is aided by development of alternative fuel vehicles by the major
automobile manufacturers. Also, ethanol blends of up to 10 percent are approved
under the warranties of all major auto manufacturers, domestic and foreign,
marketing vehicles in the United States. In fact, some recommend the use of
cleaner-burning fuels such as ethanol in their vehicle owner manuals because of
ethanol’s clean air benefits. Ethanol actually can enhance engine performance
by increasing octane and raising oxygen, cleaning and preventing engine
deposits, and acting as a gas-line antifreeze.[35]
More
than a trillion miles have been driven on ethanol-blended gasolines, and
ethanol-blended fuels represent more than 12 percent of U.S. motor gasoline
sales. Congress established the Federal ethanol program in 1979 to stimulate
rural economies and reduce the Nation’s alarming dependence on imported oil
through the production of a domestic, renewable energy source. The program has
helped build a strong domestic energy industry. From just over 10 million
gallons of production in 1979, the U.S. fuel ethanol industry has grown to more
than 1.8 billion gallons of annual production capacity. Ethanol is marketed
widely across the country as a high-quality octane enhancer and as an oxygenate
capable of reducing air pollution and improving automobile performance.
Target: 2.0
million tons.
Baseline: 8.1
million tons of air toxics were released into the air in 1993.
Target setting
method: 75 percent improvement.
Data source:
U.S National Toxics Inventory, EPA.
Toxic
air pollutants are those pollutants known or suspected to cause cancer or other
serious health effects, such as reproductive effects or birth defects, or to
cause adverse environmental effects. The degree to which a toxic air pollutant
affects a person’s health depends on many factors, including the quantity of pollutant
the person is exposed to, the duration and frequency of exposures, the toxicity
of the chemical, and the person’s state of health and susceptibility. Examples
of toxic air pollutants include benzene, which is found in gasoline; perchloroethylene,
which is emitted from some dry cleaning facilities; and methylene chloride,
which is used as a solvent and paint stripper by a number of industries.
Examples of other listed air toxics include dioxin, asbestos, toluene, and
metals such as cadmium, mercury, chromium, and lead compounds.
Scientists
estimate that millions of tons of toxic pollutants are released into the air
each year. Some air toxics are released from natural sources such as volcanic
eruptions and forest fires. Most, however, originate from manmade sources, including
both mobile sources (for example, cars, buses, trucks) and stationary sources
(for example, factories, refineries, power plants). Emissions from stationary
sources constitute almost two-thirds of all manmade air toxics emissions. (See Focus Area 24. Respiratory Diseases.)
Target: 95
percent.
Baseline: 85
percent of persons served by community water systems received drinking water
that met SDWA (Public Law 93-523) regulations in 1995.
Target setting
method: Consistent with EPA’s
strategic plan.
Data sources:
Potable Water Surveillance System (PWSS) and Safe Drinking Water Information
System (SDWIS), EPA.
Most
people in the United States obtain their drinking water from public water
supply systems. EPA has established regulations intended to ensure that community
water systems supply safe drinking water to their customers. Compliance with
the established regulations is one measure of the public’s receipt of a safe
water supply, free from disease-causing agents. In 1997, small systems (serving
25 to 3,300 people) accounted for more than 85 percent of the community water
systems in the United States but served only about 10 percent of the population.
These systems accounted for 91 percent of the violations of the EPA drinking
water regulations.[36]
According to USGS, 17 percent of the Nation’s total population were served by
their own water supply systems in 1990, compared with 18 percent in 1985.31
Target: 2
outbreaks.
Baseline: 6 outbreaks per year
originated from community water systems (1987–96 average).
Target setting method: 67 percent improvement.
Data source:
State Reporting Systems, CDC, NCID.
The
Centers for Disease Control and Prevention (CDC) compiles the results of State
investigations into waterborne disease outbreaks arising from water intended
for drinking. Between 1987 and 1996, the States reported an average of 15.5 outbreaks
per year, of which 6 outbreaks were identified as originating from community
water supplies.13, 14, 15
Limited existing data suggest that State and CDC surveillance systems for detecting
waterborne disease outbreaks are able to detect most waterborne disease outbreaks.
Target: 90.9
gallons.
Baseline: 101
gallons of domestic water per capita per day were withdrawn in 1995.
Target setting
method: 10 percent improvement.
Data source: U.S.
Department of Interior, U.S. Geological Survey (USGS).
Historically,
water management in the United States has focused on directing the country’s
abundant supplies of fresh water to meet the needs of users. This approach has
resulted in the building of large storage reservoirs and conveyance systems,
especially in the West. Increasing development costs, capital shortages,
government fiscal restraint, diminishing sources of water supply, polluted
water, and a growing concern for the environment have forced water managers and
planners to begin to rethink traditional approaches to management and to
experiment with new ones. Experts on the subject of water supply and demand
agree that the West is in transition from the era of water-supply development
to an era of water-demand management and conservation. As the population
increases in the Eastern United States, the water quantity problems already
facing the West will become apparent there as well. Estimates place the amount
of water withdrawn for public supply during 1990 at about 5 percent more than
during 1985.31
Public-supply domestic deliveries averaged 105 gallons per day for each person
served, the same as during 1985.31
The per capita use remained about the same for the past decade as the result of
active conservation programs that include the installation of additional meters
and water-conserving plumbing fixtures.31
Information about water use is available from USGS at http://water.usgs.gov/watuse/
wudo.html.[37]
Potential data
source: Clean Water Act (Public Law 92-500), Section 305-b Report, EPA.
EPA
reported that about 40 percent of the Nation’s surface waters (streams, lakes,
and estuaries) are too polluted for fishing, swimming, or other uses designated
for them by States and Tribes.[38]
Water quality in lakes, streams, and estuaries of the United States affects
both the recreational and food production use of these waters. States and
Tribes have water-quality management programs that address recreational use and
fish and shellfish harvesting. EPA establishes water-quality objectives for
these waters and monitors progress toward these goals. Discharging inadequately
treated or inappropriate quantities of human, industrial, or agriculture wastes
reduces the ability of water to provide conditions that support the growth and
harvesting of fish and shellfish for human consumption. Such discharging also
prevents water’s use as a recreational resource.
Potential data
source: EPA Beach Program.
During
the first half of the decade, EPA plans to focus on conserving and enhancing
the Nation’s waters and aquatic ecosystems so that 75 percent of waters will
support healthy aquatic communities.[39]
Part of this effort will include developing a national beach-closing survey to
monitor efforts to improve the quality of water used for recreational purposes.
Although small streams, private lakes, and ponds will not be addressed by the
EPA beach-closing survey (available at http://www.epa.gov/ost/beaches), this
program will provide a method to evaluate progress toward improving water
quality on U.S. swimming beaches. Information from the 1997 and 1998 EPA
surveys has been expanded on by the Natural Resources Defense Council (NRDC)
and published in its annual beach-closing report. The latest version is
available from NRDC and on its Web site (http://www.nrdc.org).
Potential data
sources: U.S. Department of the Interior, U.S. Fish and Wildlife Service
and USGS.
The
Biomonitoring of Environmental Status and Trends (BEST) program
(http://www.best.usgs.gov) is a cooperative activity of the USGS and the U.S.
Fish and Wildlife Service. Designed to assess and monitor the effects of environmental
contaminants on biological resources, the program measures 51 organochlorine
persistent chemicals, organophosphate and carbamate insecticides, and 21
metals.
Target: Zero
percent.
Baseline: 4.4
percent of children aged 1 to 6 years had blood lead levels
exceeding 10 µg/dl during 1991–94.
Target setting
method: Total elimination.
Data source:
National Health and Nutrition Examination Survey (NHANES), CDC, NCHS.
|
Children Aged 1 to 6
Years, 1991–94
|
Children With Blood Lead
Levels Greater Than or Equal to 10 µg/dL
|
|
8-11.
Residing in All
Housing
|
Residing in Housing
Built:
|
|
Before 1946*
|
1946 to
1973*
|
After
1973*
|
|
Percent
|
|
TOTAL
|
4.4
|
8.6
|
4.6
|
1.6
|
|
Race and ethnicity
|
|
American Indian or Alaska Native
|
DSU
|
DSU
|
DSU
|
DSU
|
|
Asian or Pacific Islander
|
DSU
|
DSU
|
DSU
|
DSU
|
|
Asian
|
DNC
|
DNC
|
DNC
|
DNC
|
|
Native Hawaiian and other
Pacific Islander
|
DNC
|
DNC
|
DNC
|
DNC
|
|
Black or African American
|
11.5
|
22.7
|
13.2
|
3.3
|
|
White
|
2.6
|
6.6
|
1.9
|
1.4
|
|
|
|
Hispanic or Latino
|
DSU
|
DSU
|
DSU
|
DSU
|
|
Mexican American
|
4.0
|
13.0
|
2.3
|
1.6
|
|
Not Hispanic or Latino
|
4.2
|
DNA
|
DNA
|
DNA
|
|
Black or African American
|
11.2
|
21.9
|
13.7
|
3.4
|
|
White
|
2.3
|
5.6
|
1.4
|
1.5
|
|
Gender
|
|
Female
|
3.3
|
7.1
|
2.8
|
1.5
|
|
Male
|
5.5
|
9.6
|
6.6
|
1.7
|
|
Family
income level†
|
|
Low
|
1.9
|
4.1
|
2.0
|
0.4
|
|
High
|
1.0
|
0.9
|
2.7
|
0
|
|
Geographic location
|
|
Population > 1 million
|
5.4
|
11.5
|
5.8
|
0.8
|
|
Population < 1 million
|
3.3
|
5.8
|
3.1
|
2.5
|
DNA = Data have not been analyzed. DNC = Data are not
collected. DSU = Data are statistically unreliable.
*Data for “all
houses” are from a separate
analysis of NHANES data; data for specific periods of time provided for information
purposes.
†Income
categories defined using poverty-income ratio (PIR) (the ratio of total family
income to the poverty threshold for the year). Low equals PIR <1.300;
middle equals PIR 1.301 – 3.500; high equals PIR >3.501.
Although considerable
progress has been made in reducing BLLs in the Nation’s children, lead
poisoning remains a preventable environmental health problem in the United
States. Culturally and linguistically appropriate information is needed
alerting persons to the dangers of lead poisonings.
Target: 98
percent of sites on the following lists:
|
8-12a.
|
National Priority List
sites
|
|
8-12b.
|
Resource Conservation and
Recovery Act facilities
|
|
8-12c.
|
Leaking underground
storage facilities
|
|
8-12d.
|
Brownfield properties
|
Baseline:
1,200 National Priority List sites; 2,475 Resource Conservation and Recovery
Act facilities; 370,000 leaking underground storage facilities; 1,500 brownfield
properties in 1998.
Target setting
method: Consistent with EPA’s
1997 Strategic Plan.
Data source: Comprehensive
Environmental Response and Cleanup Liability Information System (CERCLIS), EPA,
OSWER.
The National Priorities List
(NPL) is a published list of the most hazardous waste sites in the country
eligible for extensive, long-term cleanup under the Superfund program. Sites
listed on the NPL often are initially discovered by local or State agencies,
businesses, EPA, the Coast Guard, or the public. If a site poses a significant
risk to human health, as determined by the number and toxicity of substances
discovered at the site and its capacity to affect surrounding populations, then
the site is placed on the NPL. The Agency for Toxic Substances and Disease
Registry (ATSDR) is the Federal health agency that issues recommendations to
EPA, State health and environmental agencies, and the public concerning the
elimination of public health threats at these sites. This advice often also
includes recommendations to the public and the health care community concerning
practices to identify and prevent exposures and adverse health effects.
The Resource Conservation
and Recovery Act (RCRA) was enacted by Congress in 1976 to find a safe way to
manage and dispose of the huge volumes of municipal and industrial waste generated
nationwide. RCRA facilities are authorized and regulated by this act. With
several amendments, the act and its subsequent regulations govern the management
of nonhazardous (solid) waste, hazardous waste, and underground storage tanks
(USTs). The Leaking Underground Storage Tanks Program attempts to identify and
eliminate the threat to human health posed by groundwater or soil contamination
from petroleum released from these tanks. The term “brownfields” denotes
abandoned, idle, or underused industrial or commercial sites where expansion or
redevelopment is complicated by real or perceived environmental contamination.
Target:
13,500 visits per year.
Baseline:
27,156 visits to health care facilities were due to pesticides in 1997. (A
total of 129,592 pesticide exposures were documented in 1997.)
Target setting
method: 50 percent improvement.
Data source:
Toxic Exposure Surveillance System (TESS), American Association of Poison
Control Centers.
Pesticide exposures include
those involving disinfectants, fungicides, herbicides, insecticides, moth
repellants, and rodenticides, as defined by EPA. The American Association of
Poison Control Centers surveillance covers approximately 93 percent of the U.S.
population.
Potential data
source: Toxics Release Inventory (TRI), EPA.
Reductions in toxic pollutants
released, disposed of, treated, or used for energy recovery can be measured by
industry’s success in reducing pollution at the source—that is, not producing
pollutants at all, through manufacturing process changes, shifting to less
polluting ingredients, packaging changes, and other source reduction methods.
For that reason, all pollutants, those released and those treated or disposed
of in some manner, should be measured.
Target: 38
percent.
Baseline: 27
percent of total municipal solid waste generated was recycled in 1996 (includes
composting).
Target setting
method: Consistent with the EPA’s
1997 Strategic Plan.
Data source:
Characterization of Municipal Solid Waste, EPA.
Target and
baseline:
|
Objective
|
Allergen
|
1998–99
Baseline
|
2010
Target
|
|
Number
of Homes (in millions)
|
|
8-16a.
|
Group I dust mite
allergens that exceed 2 micrograms per gram of dust in the bed
|
36.3
|
29.0
|
|
8-16b.
|
Group I dust mite
allergens that exceed 10 micrograms per gram of dust in the bed
|
18.6
|
14.9
|
|
8-16c.
|
German cockroach
allergens that exceed 0.1 microgram per gram of dust in the bed
|
4.7
|
3.8
|
Target setting
method: 20 percent improvement.
Data source: National
Survey of Lead and Allergens in Housing, NIEHS, and U.S. Department of Housing
and Urban Development.
Indoor allergens—such as from house dust mites, cockroaches,
mold, rodents, and pets—can worsen symptoms of respiratory conditions, such as
asthma and allergies. These allergens are an important public health issue because
most people spend the majority of their time indoors, both at home and at work.
In addition, effective methods to reduce exposure to some of these allergens
exist (for example, placement of impermeable covers on mattresses and pillows
reduces dust mite allergen exposures in beds).
(See Focus Area 24. Respiratory Diseases.)
Potential data
source: Indoor Environment Division, EPA.
The air quality inside a building
impacts both the comfort and health of its occupants. Pollutants are found at
higher levels in indoor air as compared to outdoor air. In addition, most
people spend over 90 percent of their time indoors.[40]
Target: 20
percent.
Baseline: 17
percent of the population lived in homes in 1998 that had been tested for radon
(age adjusted to the year 2000 standard population).
Target setting
method: Better than the best.
Data source:
National Health Interview Survey (NHIS), CDC, NCHS.
|
Total Population, 1998
|
Persons
Living in Homes Tested for Radon
|
|
Percent
|
|
TOTAL
|
17
|
|
Race and ethnicity
|
|
American Indian or Alaska Native
|
19
|
|
Asian or Pacific Islander
|
17
|
|
Asian
|
17
|
|
Native Hawaiian and other
Pacific
Islander
|
17
|
|
Black or African American
|
18
|
|
White
|
17
|
|
|
|
Hispanic or Latino
|
14
|
|
Not Hispanic or Latino
|
17
|
|
Black or African American
|
18
|
|
White
|
17
|
|
Gender
|
|
Female
|
17
|
|
Male
|
17
|
|
Family
income level
|
|
Poor
|
15
|
|
Near
poor
|
12
|
|
Middle/high income
|
18
|
DNA = Data have not been analyzed. DNC = Data are not
collected. DSU = Data are statistically unreliable.
Note: Age adjusted to the year 2000 standard population.
Target: 2.1
million additional new homes.
Baseline: 1.4
million new homes as of 1997.
Target setting
method: 50 percent improvement.
Data source:
National Association of Home Builders Research Center Survey, National
Association of Home Builders.
Potential data
source: School Health Policies and Programs Study (SHPPS), CDC, NCCDPHP.
Potential data
sources: Association of State and Territorial Health Officials (ASTHO);
Public Health Foundation.
Target: 50 percent.
Baseline: 16 percent of persons living in homes built before 1950
in 1998 reported that their homes had been tested for the presence of lead-based paint
(age adjusted to the year 2000 standard population).
Target setting
method: Better than the best.
Data source:
National Health Interview Survey (NHIS), CDC, NCHS.
|
Persons Living in Pre-1950s Housing, 1998
|
Persons
Living in Homes Tested for Lead-Based Paint
|
|
Percent
|
|
TOTAL
|
16
|
|
Race and ethnicity
|
|
American Indian or Alaska Native
|
DSU
|
|
Asian or Pacific Islander
|
13
|
|
Asian
|
11
|
|
Native Hawaiian and other
Pacific
Islander
|
24
|
|
Black or African American
|
22
|
|
White
|
14
|
|
|
|
Hispanic or Latino
|
14
|
|
Not Hispanic or Latino
|
16
|
|
Black or African American
|
23
|
|
White
|
15
|
|
Gender
|
|
Female
|
17
|
|
Male
|
15
|
|
Family income level
|
|
Poor
|
19
|
|
Near Poor
|
16
|
|
Middle/high income
|
15
|
DNA = Data have not been analyzed. DNC = Data are not
collected. DSU = Data are statistically unreliable.
Note: Age adjusted to the year 2000 standard population.
Target: 3
percent.
Baseline: 6.2
percent of occupied U.S. housing units had moderate or severe physical problems
in 1995.
Target setting
method: 52 percent improvement.
Data source:
American Housing Survey, U.S. Department of Commerce, Bureau of the Census.
Residents of substandard housing are
at increased risk for fire, electrical injuries, lead poisoning, falls, rat
bites, and other illnesses and injuries.
Target and
baseline:
|
Objective
|
Reduction in Pesticide
Exposure as Measured by
Metabolites (Pesticide)
|
1988–94
Baseline*
|
2010
Target
|
|
Urine Concentration
|
|
8-24a.
|
1-naphthol (carbaryl)
|
36.0 µg/g
creatinine
|
25.2 µg/g
creatinine
|
|
8-24b.
|
Paranitrophenol (methyl
parathion and parathions)
|
3.8 µg/g
creatinine
|
2.7 µg/g
creatinine
|
|
8-24c.
|
3, 5,
6-trichloro-2-pyridinol
(chlorpyrifos)
|
8.3 µg/g
creatinine
|
5.8 µg/g
creatinine
|
|
8-24d.
|
Isopropoxyphenol
(propoxur)
|
1.6 µg/g
creatinine
|
1.1 µg/g
creatinine
|
*95 percent of the population had concentrations below this
level.
Target setting
method: 30 percent improvement.
Data source:
National Health and Nutrition Examination Survey (NHANES), CDC, NCHS.
Note: Data are from a subset of NHANES data and are not
nationally representative. Therefore, a population data template is not
available.
Pesticides
included in the table inhibit cholinesterase, an enzyme found in the human
body. These pesticides are among those commonly used in the home and garden,
agriculture, and industry.[41]
Metabolites (or breakdown products) of pesticides are measured in urine samples
obtained from persons aged 6 years and older. Urinary measurements of pesticide
metabolites are an accurate way to measure recent exposure to pesticides that
inhibit cholinesterase. Concentrations of pesticide metabolites in urine are
corrected for kidney function and expressed in µg/g creatinine, a measure
of kidney function.
|
Objective
|
Exposure Item
|
|
|
Heavy metals
|
|
8-25a.
|
Arsenic
|
|
8-25b.
|
Cadmium
|
|
8-25c.
|
Lead
|
|
8-25d.
|
Manganese
|
|
8-25e.
|
Mercury
|
|
|
Pesticides
|
|
8-25f.
|
2,
4-D
|
|
8-25g.
|
o-phenylphenol
|
|
8-25h.
|
Permethrins
|
|
8-25i.
|
Diazinon
|
|
|
Persistent chemicals
|
|
8-25j.
|
Polychlorinated biphenyls
|
|
8-25k.
|
Dioxins
|
|
8-25l.
|
Furans
|
|
|
Organochlorine compounds
|
|
8-25m.
|
Chlordane
|
|
8-25n.
|
Dieldrin
|
|
8-25o.
|
DDT
|
|
8-25p.
|
Lindane
|
Potential data
source: National Health and Nutrition Examination Survey (NHANES), CDC,
NCHS.
Heavy
metals, polychlorinated biphenyls (PCBs), dioxins, furans, and organochlorines are in use or have been used in the past. These compounds are
known or suspected causes of cancer, birth defects, or other diseases in
people.
Potential data
sources: Toxics Release Inventory, EPA; Environmental Defense Fund.
Other environmental health information systems include TOXLINE, Integrated Risk Information System (IRIS), Registry of Toxic Effects of Chemical Substances (RTECS®), HazDat, and Aerometric Information Retrieval System (AIRS). They can be accessed via the Internet.
Target and
baseline:
|
Objective
|
Disease
|
1997 Baseline
|
2010 Target
|
|
Number of Jurisdictions
|
|
8-27a.
|
Lead poisoning
|
51
|
51
|
|
8-27b.
|
Pesticide poisoning
|
20
|
25
|
|
8-27c.
|
Mercury poisoning
|
14
|
20
|
|
8-27d.
|
Arsenic poisoning
|
10
|
15
|
|
8-27e.
|
Cadmium poisoning
|
10
|
15
|
|
8-27f.
|
Methemoglobinemia
|
9
|
15
|
|
8-27g.
|
Acute chemical poisoning*
|
8
|
15
|
|
8-27h.
|
Carbon
monoxide
poisoning
|
7
|
51
|
|
8-27i.
|
Asthma
|
6
|
25
|
|
8-27j.
|
Hyperthermia
|
4
|
10
|
|
8-27k.
|
Hypothermia
|
Developmental
|
|
8-27l.
|
Skin cancer
|
Developmental
|
|
8-27m.
|
Malignant melanoma
|
Developmental
|
|
8-27n.
|
Other skin cancer
|
Developmental
|
|
8-27o.
|
Birth defects
|
Developmental
|
*Includes chemicals not covered elsewhere in the table.
Note: Target and baseline data are for States and the
District of Columbia. The targets will be adjusted as data for Tribes and
Territories become available.
Target setting
method: Total coverage or expert opinion.
Data sources: Periodic
surveys, Public Health Foundation and Council of State and Territorial
Epidemiologists.
Potential data
source: Profile of local health departments, National Association of County
and City Health Officials (NACCHO).
Target:
2,135,000 deaths.
Baseline: 2,668,200
deaths worldwide were attributable to these factors in 1990.
Target setting
method: 20 percent improvement.
Data source:
Global Burden of Disease, World Health Organization.
Improving
access to clean water and sanitation has been cited as the single most
effective means of alleviating human distress. Better water supply and
sanitation may increase the average life expectancy in developing countries by
15 years. Furthermore, poor sanitation ranks as one of the highest contributing
factors to the global burden of disease and injury. Diarrheal diseases, which
kill nearly 3 million persons a year in developing countries, typically result
from poor sanitation practices and the consumption of substandard drinking
water. These diseases are mostly preventable by improving environmental
services.[42], [43]
Target and
baseline:
|
Objective
|
Type of Drinking Water
and
Sanitation Service
|
1997 Baseline
|
2010 Target
|
|
Percent of Population
Receiving
Water Service or Treatment
|
|
|
Wastewater sewer service
provided
|
|
|
|
8-30a.
|
Ciudad Acuna
|
39
|
49
|
|
8-30b.
|
Matamoros
|
47
|
57
|
|
8-30c.
|
Mexicali
|
80
|
90
|
|
8-30d.
|
Nogales,
Sonora
|
81
|
91
|
|
8-30e.
|
Piedras Negras
|
80
|
90
|
|
8-30f.
|
Reynosa
|
57
|
67
|
|
|
Wastewater receiving
treatment
|
|
|
|
8-30g.
|
Ciudad Acuna
|
0
|
10
|
|
8-30h.
|
Matamoros
|
0
|
10
|
|
8-30i.
|
Mexicali
|
72
|
82
|
|
8-30j.
|
Nogales,
Sonora
|
100
|
100
|
|
8-30k.
|
Piedras Negras
|
0
|
10
|
|
8-30l.
|
Reynosa
|
100
|
100
|
Target setting
method: 10 percentage point improvement.
Data sources: EPA;
Mexico’s Comisión Nacional
de Agua; State and local health departments; American Water Works Association;
Rural Water Association; U.S.-Mexican Border Health Association.
Water
pollution is one of the principal environmental and public health problems
facing the U.S.-Mexico border area. Deficiencies in the treatment of
wastewater, the disposal of untreated sewage, and inadequate operation and
maintenance of treatment plants result in health risks.8, [44]
Better environmental services such as sewer service, wastewater treatment
service, and safe drinking water may help achieve a balance among social and
economic factors and protecting the environment in border communities and
natural areas.
 | |
1. |
Access to
Quality Health Services |
| |
3. |
Cancer |
|
|
|
|
| 3-1. | | Overall cancer
deaths |
| 3-2. | | Lung cancer
deaths |
| 3-8. | | Melanoma deaths |
| 3-9. | | Sun exposure and
skin cancer |
| 3-10. | | Provider
counseling about cancer prevention |
| 3-14. | | Statewide cancer
registries |
| |
4. |
Chronic
Kidney Disease |
| |
6. |
Disability
and Secondary Conditions |
| |
7. |
Educational
and Community-Based Programs |
| |
10. |
Food Safety |
| |
11. |
Health
Communication |
| |
12. |
Heart Disease
and Stroke |
| |
14. |
Immunization
and Infectious Diseases |
| |
15. |
Injury and
Violence Prevention |
|
|
|
|
| 15-7. | | Nonfatal
poisonings |
| 15-8. | | Deaths from
poisoning |
| 15-10. | | Emergency
department surveillance systems |
| 15-11. | | Hospital discharge
surveillance systems |
| 15-12. | | Emergency
department visits |
| 15-13. | | Deaths from
unintentional injuries |
| 15-14. | | Nonfatal
unintentional injuries |
| |
16. |
Maternal,
Infant, and Child Health |
| |
20. |
Occupational
Safety and Health |
| |
22. |
Physical
Activity and Fitness |
| |
23. |
Public Health
Infrastructure |
|
|
|
|
| 23-1. | | Public health
employee access to the Internet |
| 23-2. | | Public access to
information and surveillance data |
| 23-3. | | Use of geocoding
in health data systems |
| 23-4. | | Data for all
population groups |
| 23-5. | | Data for Leading Health Indicators, Health
Status Indicators, and Priority Data Needs at State, Tribal, and local levels |
| 23-6. | | National tracking
of Healthy People 2010 objectives |
| 23-7. | | Timely release of
data on objectives |
| 23-8. | | Competencies for
public health workers |
| 23-9. | | Training in
essential public health services |
| 23-10. | | Continuing
education and training by public health agencies |
| 23-11. | | Performance
standards for essential public health services |
| 23-12. | | Health improvement
plans |
| 23-13. | | Access to public
health laboratory services |
| 23-14. | | Access to
epidemiology services |
| 23-15. | | Model statutes
related to essential public health services |
| 23-16. | | Data on public
health expenditures |
| 23-17. | | Population-based
prevention research |
| |
24. |
Respiratory
Diseases |
|
|
|
|
| 24-1. | | Deaths from
asthma |
| 24-2. | | Hospitalizations
for asthma |
| 24-3. | | Hospital
emergency department visits for asthma |
| 24-4. | | Activity
limitations |
| 24-5. | | School or work
days lost |
| 24-6. | | Patient education |
| 24-7. | | Appropriate
asthma care |
| 24-8. | | Surveillance
systems |
| |
27. |
Tobacco Use |
|
|
|
|
| 27-9. | | Exposure to
tobacco smoke at home among children |
| 27-10. | | Exposure to
environmental tobacco smoke |
| 27-11. | | Smoke-free and
tobacco-free schools |
| 27-12. | | Worksite smoking
policies |
| 27-13. | | Smoke-free indoor
air laws |
| |
28. |
Vision and
Hearing |
(A listing of abbreviations and acronyms used in this
publication appears in Appendix H.)
Acute chemical poisoning: Unintentional poisoning
caused by chemicals that are not medicines.
Aerometric Information Retrieval System (AIRS): This
system, administered by EPA, contains information about air pollution in the
United States and other countries.
Algae: Small one- or many-celled plants that live in
the water and do not have roots, stems, or leaves but usually contain chlorophyll.
Annual vehicle miles: The distance traveled by a
passenger vehicle over a given interval of time.
Bloom: Populations of algae that have grown so large
that they can be seen in water with the naked eye.
Brownfields: Abandoned, idle, or underused industrial
or commercial sites that raise concern in nearby communities that any expansion
or redevelopment could contaminate the environment.
Chlorophyll: The green photosynthetic pigment found
chiefly in plants.
Community water system: A public water system that
provides water to at least 15 service connections used by year-round residents
or that regularly serves at least 25 year-round residents.
Disaster: Any event, either natural (such as
hurricanes, wind storms, earthquakes, volcanic eruptions, or floods) or
technological (such as the release of radiation or chemical or biologic
substances), that, because of its scope or severity, overwhelms a population’s ability to respond.
Domestic water use: Using water for household
purposes, such as drinking, preparing food, bathing, washing clothes and
dishes, flushing toilets, or watering lawns and gardens. Also called residential
water use. The water may be obtained from a public supply or may be
self-supplied by a homeowner (such as by a well).
Environmental epidemiology: The study of the effect
on human health of physical, biological, and chemical factors in the external
environment. Can include examining specific populations or communities exposed
to different ambient environments to clarify the relationship between physical,
biological, or chemical factors and human health.
Environmental hazards: Situations or conditions in
which something in the environment, such as radiation, a chemical, or other
pollutant, can cause human illness or injury.
Environmental tobacco smoke: Smoke given off by
cigarettes, pipes, or cigars to which nonsmokers can be exposed.
Environmental toxicology: Scientific analysis of the
relationship between exposure to hazardous substances found in the environment
and adverse health effects in people.
Epidemic: The occurrence in a community or region of
cases of an illness, specific health-related behavior, or other health-related
events clearly in excess of normal expectancy.
Evidence based: Empirical proof that accurately
validates professional guidance or recommendations or illustrates how an
approach has been used successfully in the past.
Good indoor air quality practices: Operation and
maintenance procedures designed to provide air quality inside a building to increase
comfort and productivity and to reduce health risks for people in the building.
Greenhouse gas (GHG): A gas that absorbs radiation of
specific wave lengths within the infrared spectrum of radiation released by the
earth’s surface and clouds
so that part of the absorbed energy is trapped and the earth’s surface warms up. Water vapor,
carbon dioxide, nitrous oxide, methane, and ozone are the primary greenhouse
gases in the earth’s atmosphere.
Hazard Ranking System (HRS): The principal screening
tool used by EPA to evaluate risks to public health and the environment
associated with abandoned or uncontrolled hazardous waste sites. HRS calculates
a score based on the potential of hazardous substances spreading from the site
through the air, surface water, or ground water and on other factors, such as
density and proximity of human population. This score is the primary factor in
deciding whether the site should be on the National Priorities List and, if so,
what ranking it should have compared to other sites on the list.
Hazardous substances: Any substance that possesses
properties that can cause harm to human health and ecologic systems. A subset
of these substances, toxics, or toxicants are substances not produced by a
living organism that can cause harm to human health and ecologic systems.
HazDat: A scientific database maintained by the
Agency for Toxic Substances and Disease Registry. Provides access to
information on the release of hazardous substances from Superfund sites or from
emergency events and on the effects of hazardous substances on health.
Household lead dust: Very fine particles containing
lead that are usually caused by the deterioration of lead paint.
Humanitarian emergencies: Emergencies that occur as a
result of disasters that destroy or have a negative effect on basic human
needs, such as food, shelter, and water.
Indoor air quality (IAQ): The overall state of the
air inside a building as reflected by the presence of pollutants, such as dust,
fungi, animal dander, volatile organic compounds, carbon monoxide, and lead.
Indoor allergens: Fine particles in indoor air that
can cause allergic reactions and respiratory problems, including dust mites and
animal dander.
Infectious agents: Any organism, such as a virus,
parasite, or bacterium, that is capable of invading the body, multiplying, and
causing disease.
Integrated Risk Information System (IRIS): This
database, maintained by EPA, contains information on health hazards from over
5,000 substances.
Metabolites: Any substance produced by biological processes
in the human body. In some cases, it is not possible to measure certain substances
(for example, pesticides) in the human body to determine exposure to those substances,
but instead it is possible to measure the secondary substance or metabolite
that is created when the human body breaks down the primary substance.
Municipal solid waste: Common garbage or trash generated
by industries, businesses, institutions, and homes.
National Ambient Air Quality Standards (NAAQS): Standards
set by EPA for the level of common air pollutants allowed by the Clean Air Act.
National Priorities List (NPL): EPA’s list of the most serious
uncontrolled or abandoned hazardous waste sites identified for possible long-term
cleanup under Superfund. The list is based primarily on the score a site
receives from the Hazard Ranking System. EPA updates the NPL at least yearly. A
site must be on the NPL to receive funds from the Superfund Trust Fund for remedial
action.
Nonattainment area: A locality where air pollution
levels persistently exceed EPA’s
National Ambient Air Quality Standards.
Nonpoint source: The source of runoff water coming
from an area such as a yard, parking lot, pasture, or other urban or
agricultural area.
Ozone: Ozone occurs naturally in the stratosphere and
provides a protective layer high above the earth. At ground-level, however,
ambient ozone is the prime ingredient of smog. Ambient ozone refers to ozone in
the troposphere—the air that
people breathe—which is
different from ozone in the stratosphere, the hole in the ozone layer. Ozone is
not emitted directly into the air but is formed readily in the atmosphere,
usually during hot summer weather, from volatile organic compounds emitted by
motor vehicles, chemical plants, refineries, factories, consumer and commercial
products, other industrial sources, and trees and from nitrogen oxides emitted
by motor vehicles, power plants, and other sources of combustion. Changing
weather patterns contribute to yearly differences in ozone concentrations from
city to city.
Particulate matter: General term used for a mixture
of solid particles and liquid droplets found in the air. These particles, which
come in a wide range of sizes, originate from “built” and natural sources. Fine particles
(PM2.5) result from fuel combustion from motor vehicles, power generation, and
industrial facilities, as well as from residential fireplaces and wood stoves.
Coarse particles (PM10) generally are emitted from other sources, such as
vehicles traveling on unpaved roads, materials handling, and crushing and
grinding operations, as well as windblown dust.
Per capita water use: The average amount of water
used per person during a standard period, generally per day. In the United
States, this measure usually is reported in gallons per day.
Persistent chemicals: Chemicals, such as organochlorine
compounds, that remain in the environment for a long time and can accumulate in
the fat of people and animals exposed to them.
Photosynthesis: Formation of carbohydrates from
carbon dioxide and a source of hydrogen (as water) in the
chlorophyll-containing tissues of plants exposed to light.
Point source: The source of water coming from a
specific location, such as a drain pipe from a wastewater treatment plant or an
industrial plant.
Poisoning: An exposure to a toxic substance that
produces negative signs or symptoms.
Premature death: A death that occurs earlier than the
life expectancy for most members of the population.
Protozoa: A subkingdom of the animal kingdom, including
all of the so-called acellular or unicellular forms (for example, Amoeba,
Giardia, and Cryptosporidium).
Radon: A colorless, naturally occurring radioactive
gas found in some soils or rocks.
Radon-resistant construction: Affordable and simple
techniques that, when incorporated during construction of a new home, reduce
indoor radon levels by preventing radon entry and providing a means for venting
radon to the outdoors.
Registry of Toxic Effects of Chemical Substances (RTECS®):
Maintained by the National Institute for Occupational Safety and Health,
this database contains information on the toxic effects of chemical substances.
The list of substances includes drugs, food additives, preservatives, ores,
pesticides, dyes, detergents, lubricants, soaps, plastics, extracts from plant
and animal sources, plants or animals that are toxic by contact or consumption,
and industrial intermediates and waste products from production
processes.
Service connection: The point at which a customer’s water supply attaches to a
water utilities distribution system.
Special classrooms: Classrooms with special characteristics,
such as laboratories and art rooms, in which particular environmental hazards
may be found.
Substandard housing: Housing with moderate or severe
physical problems in plumbing, heating, or electrical systems, upkeep and
sanitation, hallways, or kitchens.
Superfund: The program operated under the legislative
authority of Comprehensive Environmental Response, Compensation, and Liability
Act (CERCLA) and Superfund Amendments and Reauthorization Act (SARA) that funds
and carries out EPA solid waste emergency and long-term removal or remedial
activities. These activities include establishing the National Priorities List,
investigating sites for inclusion on the list, determining their priority, and
conducting or supervising cleanup and other remedial actions or both.
Sustainable development: Growth and development
within a society that is intended to meet the needs of the present without
compromising the ability of future generations to meet their own needs.
Toxic Release Inventory (TRI): EPA’s list of more that 600
designated chemicals that threaten health and the environment. Authorized under
the Emergency Planning and Community Right-To-Know Act (EPCRA) of
1986, this system requires manufacturers to report releases of these chemicals
to EPA and State governments. EPA compiles the data in an online, publicly
accessible national computerized database.
TOXLINE: A collection of online information on drugs
and other chemicals maintained by the National Library of Medicine.
Transit: Represents what used to be called “mass transit.” The 1990 Nationwide Personal
Transportation Survey (NPTS/U.S. Department of Transportation) included the
following modes in its transit count: bus, subway or elevated rail, commuter
rail, streetcar, and trolley. The 1995 NPTS characterizes a “trip” as travel to a destination (for example, worksite).
Travel to work, for instance, that includes two stops along the way (trip
chains) would constitute three “trips.”
µg/dL: Micrograms per deciliter.
Urban sprawl: Unplanned and inefficient development
of open land.
Vector-borne diseases: Illnesses that are transmitted
to people by organisms, such as insects.
Vector control: Control of any object, organism, or
thing that transmits disease from one host to another.
Waterborne disease outbreaks: Includes only outbreaks
from infectious agents and chemical poisoning incidents in which two or more
people experience a similar illness after consumption or use of water intended
for drinking and epidemiologic evidence implicates water as the source of illness.
The stipulation that at least two people be ill is waived for single cases of
laboratory-confirmed, primary amebic meningoencephalitis and for single cases
of chemical poisoning if water-quality data indicate contamination by the chemical.
[1]
World Health Organization (WHO). Indicators for Policy and Decision Making
in Environmental Health. (Draft). Geneva, Switzerland: WHO, 1997.
[2]
National Research Council. Environmental Epidemiology: Public Health and
Hazardous Wastes. Vol. 1. Washington, DC: National Academy Press, 1991.
[3]
Agency for Toxic Substances and Disease Registry (ATSDR). Priority Health
Conditions—An Integrated Strategy to Evaluate the Relationship Between Illness
and Exposure to Hazardous Substances. Atlanta, GA: U.S. Department of
Health and Human Services (HHS), 1993.
[4]
WHO. Fact Sheet 170. Geneva, Switzerland: WHO, 1997.
[5]
Commissioned Corps of the U.S. Public Health Service, HHS. <http://www.os.dhhs.gov/phs/corps/direct1.html#history>
June 14, 2000.
[6]
U.S. Bureau of Economic Analysis. Survey of Current Business. May 1995.
[7]
U.S. Environmental Protection Agency (EPA). National Air Quality and Trends
Report. Washington, DC: EPA, Office of Air and Radiation, 1997.
[8]
EPA. U.S.-Mexico Border XXI Program: Framework Document. No. EPA 160.
R-96-003. Washington, DC: EPA, 1996.
[9]
Thurston, G.D.; Gorczynski, J.E.; Currie, J.J.; et al. The nature and origins
of acid summer haze air pollution in metropolitan Toronto, Ontario. Environmental
Research 65(2):254-270, 1994.
[10]
EPA. 1997 National Toxics Inventory Report. Washington, DC: EPA, 1997.
[11]
American Lung Association. Health Costs of Air Pollution. 1990.
[12]
Craun, G.F. Statistics of waterbourne outbreaks in the U.S. (1920–1980). In:
Craun, G.F., ed. Waterborne Disease Outbreaks in the United States. Boca
Raton, FL: CRC Press, 1986.
[13]
Centers for Disease Control and Prevention (CDC). Surveillance for waterborne
disease outbreaks—United States, 1991–1992. Morbidity and Mortality Weekly
Report 42(SS-5):1-22, 1993.
PubMed; PMID 8232179
[14]
CDC. Surveillance for waterborne disease outbreaks—United States, 1989–1990. Morbidity
and Mortality Weekly Report 40(SS-3):1-21, 1991.
PubMed; PMID 1770924
[15]
CDC. Surveillance for waterborne disease outbreaks—United States, 1993–1994. Morbidity
and Mortality Weekly Report 45(SS-1):1-33, 1995.
[16]
Animal Waste Pollution in America: An Emerging Problem, Environmental Risks
of Livestock and Poultry Production. Minority Staff Report for
Senator Tom Harkin (D-IA), Ranking Member, U.S. Senate Committee on
Agriculture, Nutrition, and Forestry. 1997.
[17]
U.S. Bureau of the Census. American Housing Survey for the United States in
1995. In: Current Housing Reports. H150/95RV. Washington, DC:
U.S. Government Printing Office (GPO), 1997.
[18]
Litovitz, T.L.; Smilkstein, M.; Felberg, L.; et al. 1996 Annual Report of the
American Association of Poison Control Centers: Toxic Exposure Surveillance
System. American Journal of Emergency Medicine 15:447-500, 1997.
PubMed; PMID 9270389
[19]
Chemical Economics Handbook. SRF International, September 1997. Retrieved April
10, 1998, from DIALOG database (#359).
[20]
ATSDR. The Nature and Extent of Childhood Lead Poisoning in Children in the
United States: A Report to Congress. Washington, DC: HHS, 1988.
[21]
CDC. Screening Young Children for Lead Poisoning: Guidance for State and
Local Public Health Officials. Atlanta, GA: CDC, 1997.
[22]
CDC. Update: Blood lead levels in the United States, 1991–1994. Morbidity
and Mortality Weekly Report 46:143, 1997.
[23]
Mannino, D.M.; Homa, D.M.; Pertowski, C.A.; et al. Surveillance for
asthma—United States, 1960—1995. In: CDC Surveillance Summaries, April 24,
1998. Morbidity and Mortality Weekly Report 47(SS-1):1-27, 1998.
PubMed; PMID 9580746
[24]
National Heart, Lung, and Blood Institute. Data Fact Sheet. Asthma
Statistics. Bethesda, MD: National Institutes of Health, Public Health
Service, 1999.
[25]
President’s Task Force on Environmental Health Risks and Safety Risks to
Children. Asthma and the Environment: A Strategy to Protect Children.
Washington, DC: the Task Force, 1998.
[26]
Redd, S. Chief, Air and Respiratory Branch, National Centers for Environmental
Health, CDC. Personal communication.
[27]
Weiss, K.B.; Gergen, P.J.; and Hodgson, T.A. An economic evaluation of asthma
in the United States. New England Journal of Medicine 326:862-866, 1992.
PubMed; PMID 1542323
[28]
Hu, P.S. Summary of Travel Trends 1995 Nationwide Personal Transportation
Survey. Washington, DC: U.S. Department of Transportation, 1999, 13.
[29]
Schmidt, C. Environmental Health Perspectives 106(6):1998.
[30]
Institute of Medicine. Toward Environmental Justice—Research, Education, and
Health Policy Needs. Washington, DC: National Academy Press, 1999.
[31]
U.S. Geological Survey. U.S. Geological Survey: Estimated use of water in the
United States in 1990. USGS National Circular 1081. Washington, DC: GPO,
1993.
[32]
Toxnet7, National Library of Medicine, Toxicology and Environmental Health Information
Program, Bethesda, MD.
[33]
Internet Grateful Med, National Library of Medicine, Bethesda, MD.
[34]
U.S. Department of Energy Clean Cities Program <http://www.ccities.doe.gov/>.
[36]
EPA. Description of FY 1993–FY 1997 PWS Statistics, Safe Drinking Water
Information System (SDWIS/FED). Washington, DC: EPA, Office of Enforcement
and Compliance Assurance, 1997 data frozen April 1, 1998.
[37]
Solley, W.B.; Pierce, R.R.; and Perlman, H.A. Estimated Water Use in the
United States, 1995, U.S. Geological Survey Circular 1200. Washington, DC:
U.S. Department of Interior, GPO, 1998.
[38]
EPA. National Water Quality Inventory: 1994 Report to Congress. Washington,
DC: EPA, 1994.
[39]
EPA. Strategic Plan. Washington, DC: EPA, 1997.
[40]
Spengler, J.D., and Sexton, K. Indoor air pollution: a public health perspective.
Science 221:9-17, 1983.
[41]
EPA. Pesticides Industry Sales and Usage—1994 and 1995 Market Estimates. Washington,
DC: EPA, 1997.
[42]
World Resources Institute. World Resources: A Guide to the Global
Environment, the Urban Environment, 1996–1997. Oxford, United Kingdom:
Oxford University Press.
[43]
Murray, C.J.L., and Lopez, A.D., eds. The Global Burden of Disease.
Cambridge, MA: Harvard University Press, 1996.
[44]
WHO. The World Health Report 1997: Conquering Suffering, Enriching Humanity.
Geneva, Switzerland: WHO, 1997.
Go
to Healthy People 2010 Volume I Table of Contents
Go
to main Table of Contents