
 |
|
 |
![]()

Healthy
People ... tracking the Nation's
health
|
Healthy People 2010
Progress Review
Focus Area 22
Physical Activity and Fitness
Slide 1
Title slide for the June 26th, 2008 data presentation by Richard Klein.

Slide 2
Physical Activity and Fitness benefits slide. Regular physical activity decreases the risk of obesity and chronic diseases, controls weight, reduces blood pressure, and improves blood glucose and cholesterol control. Physical activity also reduces feelings of depression and anxiety and promotes psychological well-being.
Notes: Decreases the risk of obesity and chronic diseases: cardiovascular disease (CVD), high blood pressure, diabetes, colon cancer, and osteoporosis. Builds and maintains healthy bones and muscles, controls weight, builds lean muscle, reduces fat, reduces blood pressure, and improves blood glucose and cholesterol control.

Slide 3
This slide contains Healthy People 2010 objectives highlighted for this Progress Review categorized by individual behavior, organizational policy, and environmental intervention and programs. Objectives are classified as
a) having met or exceeded,
b) made progress towards,
c) made little or no progress, or
d) moved away from their Healthy People targets.
Data are from the Healthy People DATA2010.

Slide 4
This slide shows data for leisure time physical activity among adults 18 years and older in 1997 and 2006. Data are from the National Health Interview Survey (NHIS), National Center for Health Statistics (NCHS), Centers for Disease Control and Prevention (CDC).
Notes:
1997
None - 40
Some - 28
Moderate/Vigorous - 32
2006
None - 39
Some - 30
Moderate/Vigorous - 31

Slide 5
This slide contains data trends for no leisure time physical activity among adults by gender and age in 1997 and 2006. Trend data for no leisure time physical activity are presented for 1997-2006. Data are from NHIS, NCHS, CDC.
Notes: The percent of adults reporting no leisure-time physical activity has declined for all adults (total), females, and for people ages 45+.

Slide 6
This slide contains data for no leisure time physical activity among adults by gender, race/ethnicity, and education in 2006. Data are from NHIS, NCHS, CDC.

Slide 7
This slide contains data on leisure time moderate or vigorous physical activity among adults by gender and age in 1997 and 2006. Moderate or vigorous physical activity is regular leisure-time physical activity (moderate activity 30+ minutes/5+ times per week or vigorous activity 20+ minutes/3+ times per week). Trend data for no leisure time physical activity are presented for 1997-2006. Data are from NHIS, NCHS, CDC.
Notes: There has been no significant change in the percent of adults reporting moderate leisure-time physical activity.

Slide 8
This slide contains the data on leisure time moderate or vigorous physical activity among adults by gender, race/ethnicity, and education in 2006. Data are from NHIS, NCHS, CDC.

Slide 9
This slide contains data on risk of selected health problems by leisure time physical activity level in 2006. The selected health problems are fair or poor health status, diagnosed diabetes, and serious psychological stress. Data are from the National Health Interview Survey (NHIS), National Center for Health Statistics (NCHS), Centers for Disease Control and Prevention (CDC).

Slide 10
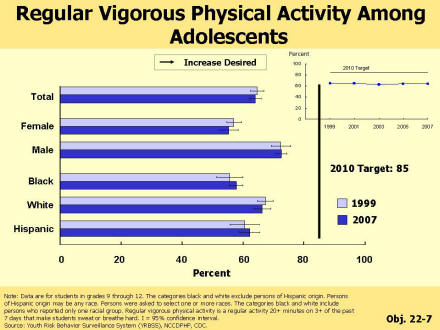
This slide contains the trend in vigorous physical activity among adolescents between 1999 and 2007. Vigorous physical activity is a regular activity 20+ minutes on 3+ of the past 7 days that make students sweat or breathe hard. Trend data for moderate physical activity among adolescents are presented for 1999-2007. Data are from Youth Risk Behavior Surveillance System (YRBSS), National Center for Chronic Diseases Prevention and Health Promotion (NCCDPHP), CDC.
Slide 11
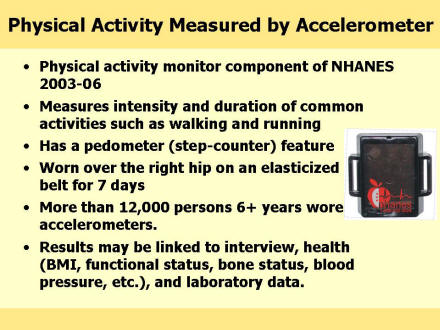
This slide contains information on physical activity component of National Health and Nutrition Examination Survey, NCHS. The physical activity was measured by accelerometer for persons aged 6 years and older in 2003-2006. Accelerometers count steps and the information on activity intensity and duration can be used to determine how long people perform light, moderate, and vigorous activity. When worn on the hip, the monitor primarily measures body movements such as walking or jogging—activities where one’s body moves a distance. Walking and similar types of activity are the main source of physical activity for most individuals.
Notes: Physical activity has a protective effect on our health. NHANES data have documented the problem of overweight and obesity in this country. Determining the activity patterns of adults and children is more challenging. Many physical activities are part of the daily routine, and therefore difficult to recall and report.
Getting reasonable reports about the activity of children is particularly challenging because kids find it particularly hard to estimate frequency and duration of activities, and proxies (usually parents) may not observe the children for much of the day. Until recently, we have not had a feasible way to measure activity levels in the general population because the equipment has been too bulky, expensive, and complicated to use. Now we have a tool we can use.
Accelerometers count steps and the information on activity intensity and duration can be used to tell us how long people perform light, moderate, and vigorous activity.
When worn on the hip, the monitor primarily measures body movements such as walking or jogging—activities where one’s body moves a distance. Walking and similar types of activity are the main source of physical activity for most individuals. The activity monitors are powered by a watch battery and are completely safe to wear.
Slide 12
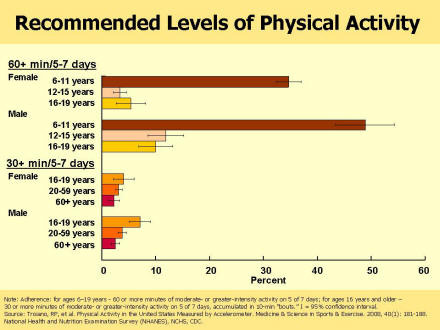
This slide contains data for physical activity measured by accelerometer for persons aged 6 years and older in 2003-2004. Data are from National Health and Nutrition Examination Survey (NHANES), NCHS, CDC. Source: Troiano, RP, et al. Physical Activity in the United States Measured by Accelerometer. Medicine & Science in Sports & Exercise.2008, 40(1): 181-188.
Slide 13
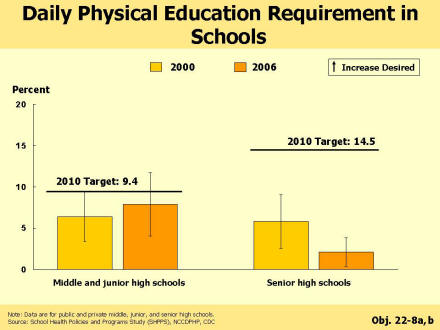
This slide contains the trend in physical education requirement in public and private middle, junior, and senior high schools between 2000 and 2006. Data are from School Health Policies and Programs Study (SHPPS), NCCDPHP, CDC.
Notes: Number of public and private middle, junior, and senior high schools for which physical education (PE) is offered 5 days a week, and the number of years of required PE equals the number of grades in the school.
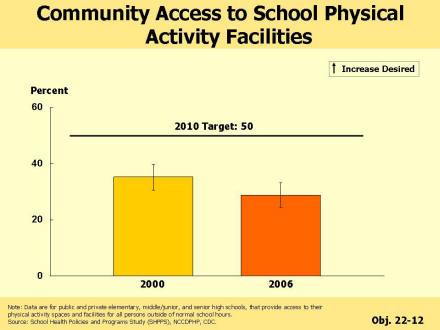
Slide 14
This slide contains the trend in community access to school physical activity facilities between 2000 and 2006. Data are for public and private elementary, middle/junior, and senior high schools, that provide access to their physical activity spaces and facilities for all persons outside of normal school hours. Data are from SHPPS, NCCDPHP, CDC.
Notes: Number of public and private elementary, middle/junior, and senior high schools that provide community access to their physical activity or athletic facilities in non school time.
Slide 15
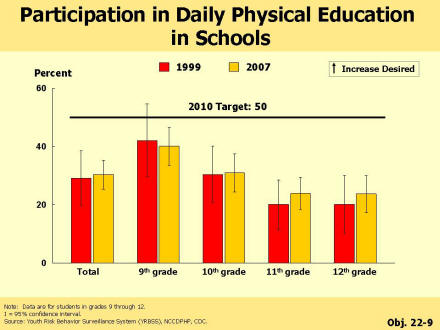
This slide contains the trend in participation in daily physical education among students in grades 9 through 12 by grade level between 1999 and 2007. Data are from YRBSS, NCCDPHP, CDC.
Notes: Number of students in grades 9 through 12 who report participating in physical education classes five times per week.
Slide 16
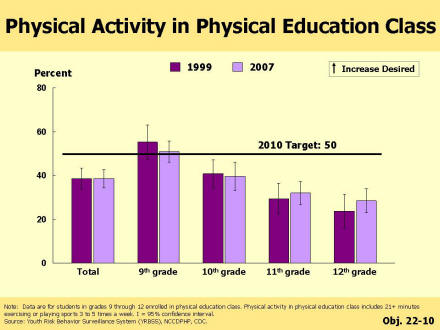
This slide contains the trend in physical activity in physical education class among students in grades 9 through 12 by grade level between 1999 and 2007. Physical activity in physical education class includes 21+ minutes exercising or playing sports 3 to 5 times a week. Data are from YRBSS, NCCDPHP, CDC.
Notes: Number of students in grades 9 through 12 who report spending 21 or more minutes exercising or playing sports in physical education class three to five times a week.
Slide 17
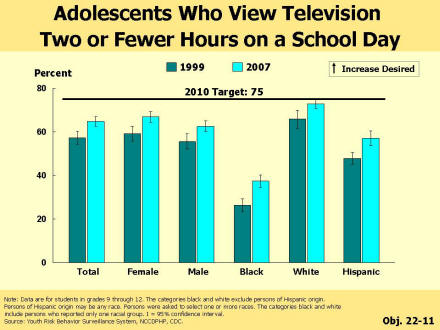
This slide contains the trend for adolescents who view television two or fewer hours on a school day between 1999 and 2007. Data are for students in grades 9 through 12. Data are from YRBSS, NCCDPHP, CDC.
Notes: Number of students in grades 9 through 12 who report watching TV for 2 or fewer hours on an average school day.
Slide 18
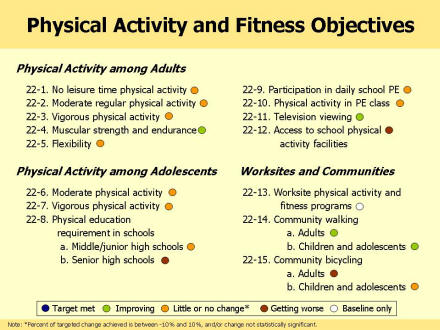
This slide summarizes the status of all Physical Activity and Fitness objectives. The objectives are categorized as
a) having met or exceeded their target,
b) made progress towards their target,
c) moved away from their target,
d) had little or no change, or
e) had baseline data only.
Data are from the Healthy People DATA2010.
Slide 19
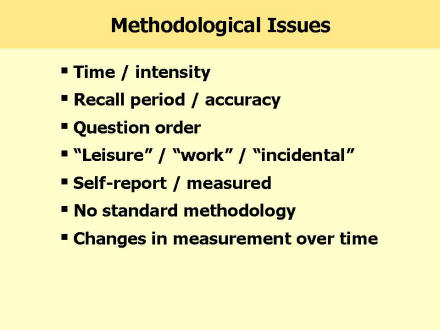
This slide contains the discussion on data issues related to physical activity data collection and complex measurement methodology.
Slide 20
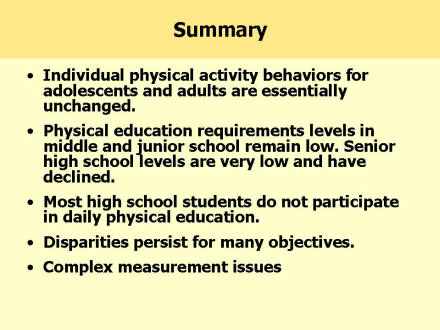
This slide provides summary points from the presentation:
Slide 21
Acknowledgements.
Slide 22
This slide indicates that Progress Review data and slides can be found at: http://www.cdc.gov/nchs/hphome.htm.

Healthy People 2000 |
Healthy People 2010 | Related Links |
This page last reviewed
September 08, 2008
|
