Maps & Visualizations
The Mapping and Visualization Team based at Duke University's Marine Geospatial Ecology Lab is responsible for developing and sharing methods to display the results of the ten-year Census of Marine Life. Most Census projects are developing their own maps and visualizations.
The following images highlight a variety of maps and visualizations resources produced by the Census projects. Additional information can be found on each individual Census project website.
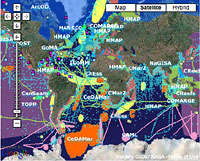

IPY Cruise Tracks
in

The cruise tracks show numerous Census scientific voyages to the Southern Ocean during the International Polar Year. Image: CAML.


Mapping Microbes
in
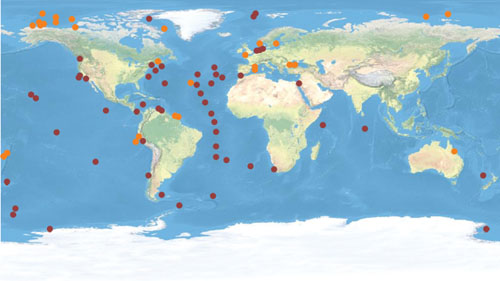
The map shows the locations of samples collected by 40 field projects employing the 454 tag-pyrosequencing technology. Image: ICoMM.
Ocean Biogeographic Information System Records
in

Since 2000, the Ocean Biogeographic Information System, OBIS, has grown to 14 million records of more than 80,000 species from 232 databases. The red dots on the map show the global distribution of the OBIS records. Image: OBIS.
Proposed Marine Protected Area Along the Mid-Atlantic Ridge
in
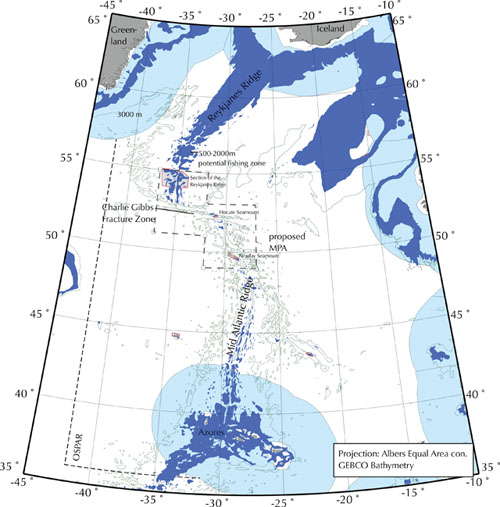
One of the proposed marine protected areas along the Mid-Atlantic Ridge. Image: Sabine Christiansen, World Wildlife Fund.
Relative Abundance of Marine Life by Human Cultural Period
in

Historical changes in estuaries and coastal seas reveal that human activities have depleted 40% of important species and 65% of seagrass and wetland habitats. Image: HMAP.
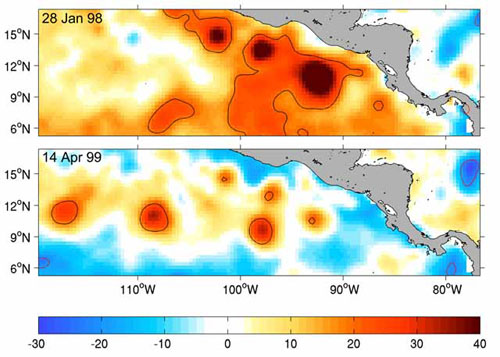
Species richness and water temperature
in

Patterns of global tuna and billfish species richness at 100 m depth were predicted from water temperature. Distributions for 18 species were derived from individual temperature tolerances and overlaid to generate a pattern of species diversity.