
Revised June 2007
![]() Download a free PDF of this guide.
Download a free PDF of this guide.
Contents
Summer annual broadleaf
Biennial broadleaf
Perennial broadleaf
Summer annual grass
Winter annual grass
Perennial grass
Plants resembling grasses
Herbicides
Related pages
Other related Web sites
Use our feedback form to ask questions or make comments about IPM1007.
Publication search


Figure 1
Cotyledons.
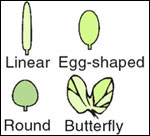
Figure 2
Variations of cotyledon shape.

Figure 3
Characteristic leaf shapes.

Figure 4
Opposite and alternate leaves.
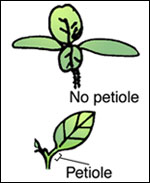
Figure 5
Petiole.

Figure 6
Rhizome.

Figure 7
Ligule.

Figure 8
Auricle.

Figure 9
Sedges have 3-sided stems.
This publication is intended to serve as a practical reference and educational tool to be used in scouting corn and soybean fields for the presence of weeds, identifying whether a rescue treatment is necessary, and determining crop response to herbicide activity. This publication consists of two main sections. The first section includes information on weed identification, scouting and mapping procedures, and a discussion of economic thresholds for weeds. An identification key and color photographs of weeds common to Missouri are also included. The second section includes information on diagnosing herbicide injury. It discusses the various causes and conditions contributing to herbicide injury. It also includes a key to help determine which herbicide family might have caused the injury symptoms, and color photos of herbicide injury caused by various herbicide families.
Weeds can be classified into three primary categories: broadleaves (dicots), grasses (monocots), and sedges. To identify broadleaf seedlings, it is common to look first at the cotyledons or seed leaves. The cotyledons are the first pair of leaves that open after emergence (Figure 1). Cotyledons have various shapes and sizes; they may be linear-, egg-, round- or butterfly-shaped or have variations of each (Figure 2). Look at other features of the weed, such as the true leaves (leaves emerging after cotyledons) and stems. Leaf shape can vary dramatically and is a consistent key to plant identification (Figure 3). The leaves may be alternately or oppositely arranged along the stem (Figure 4). Some leaves may be attached to a short stem, known as the petiole, while others may lack a petiole (Figure 5). Check the leaf surfaces for the presence of hair and the amount of waxiness. Stems can also assist in identifying a weed; they have various shapes and amounts of hair, if any. Finally, dig or carefully remove the roots from the soil and look for the presence of rhizomes (Figure 6), creeping roots, or other structures such as tubers. Rhizomes are underground vegetative stems from which new plants are generated. The presence of these vegetative structures will indicate that the weed's life cycle is perennial.
Grasses are usually more difficult to identify than broadleaf weeds. It is especially useful to have a hand or pocket lens with 10x magnification power because grasses possess subtle characteristics that distinguish them from one another. Most of these identifying features are contained in the collar region. The collar region can be seen by carefully pulling the leaf blade back from the stem. When the blade is pulled back, look for the ligule (Figure 7). The ligule is a projection at the base of the leaf blade. If a ligule is present, it will appear as a ring of hair or it may be membranous (thin and almost transparent). It can be relatively large or small, and its tip can be jagged or smooth. Some grassy weeds will have auricles; these are small fingerlike structures that appear to clasp around the stem at the collar (Figure 8). Like broadleaf weeds, grasses may be hairy on either the top or bottom leaf surface, or both. Grass stems can be a key feature; most are rounded, while others are flattened. A few grassy weeds will also have hair on their stems.
Sedges can be relatively easy to distinguish from grasses and broadleaf weeds. From a distance, they appear grasslike; however, upon closer inspection, the stems are triangular in shape (Figure 9). The leaves on sedges usually appear very glossy or shiny in texture and the leaves are hairless and occur in sets of three.
See the weed identification pages for a vegetative key and for photographs to assist in identifying some of the most common weeds in the Midwest.
Information on weed populations in a field is needed within two weeks after crop emergence to determine performance of preplant and preemergence herbicides as well as the need for supplemental postemergence strategies. With increased adoption of total postemergence programs, it becomes increasingly important to recognize the weed management issues soon after crop emergence. In fields using only postemergence weed management strategies, the competitive load represented by weeds on the crop is greater early in the season than it is with programs using preplant or preemergence herbicides. Although preplant or preemergence herbicides may occasionally provide an unacceptable level of weed control, they will still thin the emerging weed population and reduce the competitive load on the crop early in the season.
To identify the location of weeds in a field, sample areas representing no more than 5 to 7 acres should be recorded on a map of the field (see Figure 10). This map will provide information on location of weed problems and be useful for monitoring changes in weed infestations from year to year. When drawing the map, outline the boundaries of the field and indicate points of reference, such as waterways, terraces, terrace inlets, buildings, fences, or timber. A map can also be generated using global positioning satellite (GPS) equipment. Identify and record (including height and growth stage) all species found, and determine the severity of the infestation either by counting or by estimating the number of weeds in 100 square feet (10 feet by 10 feet) or by categorizing the infestation into 1 of 7 categories (none, very low, low, moderate, intermediate, high, very high). Table 1 and Table 2 show the approximate yield loss caused by several annual species at different densities. The estimates shown in Tables 1 and 2 assume that scouting takes place when the corn is less than 5 inches tall (a yield goal of 150 bushels per acre) or when soybean plants are in the unifoliate growth stage (a 50 bushels per acre yield goal). Yield loss information on additional weeds at different weed and crop growth stages is available through the use of the WeedSOFT™ yield loss calculator.
When making weed scouting maps, include notes on locations of perennial weeds and severe infestations of annual weeds. These areas will most likely require annual management tactics. Record early-season soil moisture conditions, because adequate soil moisture is needed for effective weed control with soil-applied herbicides. Inadequate moisture can mean that there is not enough water for herbicide activation and absorption by weed seedlings. Excessive rainfall will cause dilution of the herbicide by moving it deeper (leaching) into the soil profile or from one area of the field to another (surface runoff).
A late-season weed survey should also be done in August to determine the effectiveness of the strategies employed on a given field and assess late-season weed emergence and potential issues for the following growing season. Ideally one wants as much detail in the map generated in this survey as in the map for the early-season survey. However, less detail (10-acre grids) would usually be sufficient in the late-season survey to assess overall effectiveness of a weed management program. This will help the grower plan the cropping system and management strategy for the next season.
Table 1
Approximate yield loss with various densities of annual weeds in corn 0 to 5
inches tall with a 150 bushels per acre yield potential.
| Weed density category (yield loss potential) | Giant foxtail (2 to 4 inches tall) | Shattercane (less than 6 inches tall) | Common waterhemp (2 to 4 inches tall) | Velvetleaf (2 to 4 inches tall) | Morningglory (0 to 2 inches tall) | Common cocklebur (2 to 4 inches tall) | Approximate yield loss by a single species | Approximate yield loss by all species |
|---|---|---|---|---|---|---|---|---|
| Weed density per 100 square feet | Bushels per acre | Bushels per acre | ||||||
| None | 0 | 0 | 0 | 0 | 0 | 0 | 0 | 0 |
| Very low (0 to 1 percent) | 10 | 3 | 3 | 2 | 2 | 1.5 | 2 | 12 |
| Low (1 to 2 5 percent) | 20 | 7 | 8 | 5 | 4 | 4 | 5 | 23 |
| Moderate (2 5 to 5 percent) | 40 | 14 | 16 | 10 | 9 | 7 | 9 | 37 |
| Intermediate (5 to 10 percent) | 85 | 30 | 35 | 20 | 19 | 15 | 18 | 54 |
| High (10 to 20 percent) | 220 | 78 | 85 | 52 | 50 | 40 | 35 | 71 |
| Very high (20 to 30 percent) | 430 | 150 | 175 | 103 | 100 | 78 | 50 | 80 |
Table 2
Approximate yield loss with various densities of annual weeds in soybeans in
the unifoliate stage with a 50 bushels per acre yield potential.
| Weed density category (yield loss potential) | Giant foxtail (2 to 4 inches tall) | Shattercane (less than 6 inches tall) | Common waterhemp (2 to 4 inches tall) | Velvetleaf (2 to 4 inches tall) | Morningglory (0 to 2 inches tall) | Common cocklebur (2 to 4 inches tall) | Approximate yield loss by a single species | Approximate yield loss by all species |
|---|---|---|---|---|---|---|---|---|
| Weed density per 100 square feet | Bushels per acre | Bushels per acred | ||||||
| None | 0 | 0 | 0 | 0 | 0 | 0 | 0 | 0 |
| Very low (0 to 1 percent) | 2 | 1 | 1 | 1 | 1 | 1.5 | 0.5 | 16 |
| Low (1 to 2 5 percent) | 5 | 2 | 2 | 1.5 | 1.5 | 1 | 2 | 11 |
| Moderate (2 5 to 5 percent) | 10 | 3 | 4 | 2 | 2 | 2 | 3 | 17 |
| Intermediate (5 to 10 percent) | 20 | 7 | 8 | 4 | 4 | 4 | 6 | 25 |
| High (10 to 20 percent) | 40 | 15 | 16 | 10 | 10 | 8 | 13 | 32 |
| Very high (20 to 30 percent) | 60 | 22 | 25 | 15 | 14 | 11 | 18 | 34 |

Figure 10
This sample scouting report includes a map of the field being sampled.
The economic threshold for weeds may be defined as the density of a weed population at which control is economically justified. Control may be economically justified if there is potential for yield loss, crop quality loss, harvesting difficulties, aesthetic issues or future weed management difficulties due to weed seed production. Economic thresholds developed for both insects and weeds assume that crop yield loss can be predicted by an accurate estimate of pest density, if crop market price, expected yield, control costs, and effectiveness of the control are known. However, economic thresholds developed for weeds should also include time of weed emergence relative to crop emergence, duration of weed interference in the crop, and herbicide effectiveness on large weeds. Regardless of whether one uses a threshold concept or not, decisions to control weeds must be made in a timely manner so that postemergence herbicide treatments are both efficacious and cost-effective. Herbicide applications on smaller weeds allow for the use of lower application rates, which can reduce expenses and the chemical load into the environment. Delaying applications can allow weeds to be controlled with a single postemergence application, but rates will need to be higher and some competition with the crop can occur. Additionally, timely detection of weed escapes allows producers and custom applicators to base late-season control decisions on the threshold concept to determine whether it is economical to control the weed.
It is important to understand that each field has a specific amount of resources available for growth and development of plants. The amount varies from field to field and from year to year with environmental conditions. If a weed-free crop is grown, the crop has all of the resources available for its own use. If weeds are allowed to grow with the crop, they will use a portion of the resources and may cause crop losses severe enough to justify control measures. In general, removing an infestation of insects or disease from a crop does not necessarily lead to an infestation by more of these pests. However, if a weed species is removed from an area, other species may invade unless the crop is sufficiently competitive to prevent it.
How long can a grower allow weeds to grow with the crop before yields are compromised? This length of time is often termed the critical period for early-season competition. This period determines how long a grower can wait before initiating a postemergence herbicide application or tillage operation to reduce weed pressure. Weed species prevalence and density are strongly correlated with the critical period; fields infested with cocklebur, sunflower, and giant ragweed have shorter critical periods than do those fields with giant foxtail and common waterhemp. Fields with high densities of broadleaf weeds have shorter critical periods than fields with low densities or grass weeds. Environmental factors, especially the availability of soil moisture early in the season, may at times override the impact of weed density on the critical period. The crop row width, or time required for the crop to develop a canopy sufficient to shade weeds, would also affect the recommended weed-free period. In general, a narrow-row soybean field (less than 15-inch rows) may develop a canopy as much as 10 days earlier than a field with wider rows. Finally, late-emerging weeds that escape control may reduce harvesting efficiency or produce viable weed seed, lowering not only crop yield but also crop quality.
Some general assumptions about weed interference can help the crop consultant make an appropriate management decision. Weed competition studies at the University of Missouri and in other states indicate that crop yield losses are unlikely if weeds are allowed to emerge and grow with the crop for no more than four or five weeks after crop emergence, and the crop thereafter is kept free of weeds until harvest. Alternatively, if weeds are kept out of the field for six to eight weeks after crop emergence, any weeds that emerge later will not cause significant yield reductions, although they may produce seeds, cause harvesting problems, or reduce crop quality.
An economic threshold may be important when considering whether a postemergence weed management decision is needed. Examples 1 and 2 are predictions from WeedSOFT™ yield loss calculator and based solely on the effect of various weed densities on crop yield. To use the calculator, some assumptions are made regarding the relative weed-free yield of the crop and either the count (number of weeds per 100 square feet) or categorization of the yield loss potential by each weed species present. The categories of yield loss potential for the weeds are designated as none, very low, low, moderate, intermediate, high, and very high. Approximate densities of several weeds that define these yield loss categories are shown in Tables 1 and 2. If a particular weed is not listed, you can use WeedSOFT™ or compare the unlisted weed and a weed in Tables 1 or 2 with similar leaf size and plant height characteristics to get a rough estimate of yield loss potential. It is important to remember that weed species differ in their competitiveness based largely on their growth rate, size (shoot and root mass), canopy shape, and emergence date. Competitive index (CI) is a term used to describe the relative competitiveness of a weed species and is expressed in a range from 1 to 10 (Table 3).
Table 3
Competitive indices of weed species commonly found in Missouri.
| Weed | Competitive index |
|---|---|
| Common cocklebur | 5.5 |
| Hemp dogbane | 1.0 |
| Giant foxtail | 3.0 |
| Ivyleaf and pitted morningglory | 5.5 |
| Fall panicum | 1.5 |
| Common ragweed | 1.5 |
| Giant ragweed | 8.0 |
| Shattercane | 3.5 |
| Common sunflower | 10.0 |
| Velvetleaf | 4.2 |
| Common waterhemp | 2.5 |
A plant with a CI of 1 is 1/10 as competitive as a plant with a CI of 10. Figures 11 and 12 show yield loss due to season-long competition of several densities of weeds commonly found in the Midwest and also shows differential competitiveness of individual weed species. Competitive load is a term used to describe the total competitive effect of a weed population on crop yield, and is a summation of the number of individual weeds multiplied by the CI of each weed. As seen in Figures 11 and 12, competitive load approaches 100 percent yield loss asymptotically, based on the fact that at high weed densities, weeds begin to interfere with one another and have progressively less effect on crop yield.
Based on information gathered in scouting and an understanding of treatment expenses, expected crop prices, and relative competitiveness of weeds present, a decision to treat can then be made based on the expected gain from various weed removal tactics. These expectations vary from year to year depending on environmental factors.
There are a few items to consider whether one uses a software package or common sense to make control decisions. First, weed infestations that can cause a 10 percent or greater yield loss will usually justify treatment if they are within size limits for maximum herbicide effectiveness. Second, failure to obtain 100 percent weed control must be considered. This becomes increasingly important if treated weeds are stressed from drought or cool weather or larger than specified on the herbicide manufacturer's label. And finally, grain quality, harvesting difficulties, aesthetics (landlord pressure), and weed seed production are not considered in the examples above. Therefore, common sense should always be combined with other decision aids in any weed management decision.

Figure 11
Predicted yield loss with season-long competition of various weed densities
in soybeans, assuming a 50 bushel per acre yield goal.

Figure 12
Predicted yield loss with season-long competition of various densities of selected weeds in corn, assuming a 150 bushels per acre yield goal.
Correct diagnosis of crop injury from any source requires an accurate investigation of the symptoms and as much information as possible about the history of the area where symptoms are present. Herbicides are sometimes blamed for crop injury caused by fungal, bacterial, or viral pathogens, nematodes, nutrient deficiencies or excesses, insect damage, or adverse weather conditions (e.g., excess soil moisture) that cause similar symptoms. Therefore it is helpful for the person diagnosing the injury to have detailed information on each injury situation as well as plant and soil samples for evaluation before attempting to identify the cause of injury.
Herbicide injury frequently occurs in distinct patterns within a field and can be caused by misapplication of the herbicide or by faulty equipment. Signs indicating faulty application of herbicides include streaks of injury resulting from improper incorporation, overlapping of the spray pattern, improper nozzle size and spacing, altered nozzle pattern (worn nozzle), or improper boom height. Injury occurring at the field ends may result from failure to shut off the sprayer when making turns or decreased sprayer speed. Injury symptoms may follow lines of water movement or appear where changes occur in soil type, organic matter content, pH, or field topography. Look for spray or drift patterns and compare adjacent, untreated fields with the areas showing injury symptoms. Also, compare the response of susceptible weed species and watch for symptoms caused by insects, disease, mechanical damage, wind, drought, and other environmental conditions.


Limited selectivity
Selective herbicides kill some plants but not others
(i.e., control several weeds but do not kill the crop). Most herbicides have
at least a 4x margin of selectivity on labeled crops. This means that the crop
can tolerate at least four times the amount of herbicide needed to control the
target weeds. However, the margin of selectivity on some crops is often narrow
with specific herbicides. This means that under conditions that stress the crop
(environmental conditions, soil compaction, or presence of other pests), or if
inaccuracies occur in application, herbicide injury can occur. Margins of selectivity
can be improved by using proper application rates for a soil type, carefully
choosing spray adjuvants, and avoiding applications to stressed crops (growth
stages) or where crop sizes exceed labeled limits.
Faulty application
Herbicides are expensive and margins of selectivity can
be narrow. This is why it is important to inspect and calibrate application equipment
carefully to ensure accurate application rates. Inspections should occur every
year before the equipment is used and more often if large acreages are treated
several times.
To avoid faulty applications:
Environmental conditions
Weather conditions favorable for rapid crop emergence
and growth minimize the risk of herbicide injury and maximize herbicide activity
on target weeds. Planting crops too deep results in the emerging shoot or growing
point of the crop being in contact with the soil herbicide longer. On the other
hand, planting crops too shallow (especially corn) will also increase the risk
of injury. Planting crops too shallow may result in the seed sprouting in herbicide-treated
soil. Under cool, wet conditions, the metabolism of the plant is reduced. This
means that the crop grows more slowly and the herbicide is detoxified more slowly,
resulting in greater injury. Conversely, under warm, humid conditions, herbicide
uptake can occur rapidly and injury may result. Hot, dry conditions can also
magnify the effect of the herbicide on the plant since the plant is under stress.
Additional secondary stresses such as diseases, insects, and poor soil conditions
can all reduce the vigor of the crop and magnify the effect of herbicide injury
on the crop.
Genetic susceptibility
Crops with different genetic backgrounds may also
have different margins of selectivity to certain herbicides. Many seed companies
have begun to make this information available to growers. Differences in susceptibility
could be due to morphological (leaf angle or pubescence) or physiological (ability
to detoxify the herbicide) differences.
Herbicide drift
Off-site movement of herbicides is called drift. Particle
drift is movement of spray particles from the application equipment while the
application is being made. These particles never reach the intended target area.
Vapor drift is the movement of herbicide vapors. Vapor drift can occur at application
and up to several days after application. Particle drift can be minimized by
using spray application parameters that minimize production of small spray particles
(using a larger orifice or changing the angle at which the droplet leaves the
nozzle) and not spraying in windy conditions. In some situations, drift retardent
agents can be added to the spray solution to increase viscosity and hence reduce
drift. Vapor drift can be minimized by using less volatile formulations of the
herbicide and not spraying when air temperatures exceed 85 degrees F. For additional
information, refer to University of Missouri publication G1886,
Controlling Drift of Crop Protection Materials, and University of Wisconin publication I-6-2004-5M,
Dicamba Injury to Soybeans.
IPM1007, revised June 2007