| |
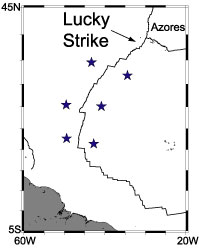 General
location of the Lucky
Strike site. See epicenter
map for detailed view.
General
location of the Lucky
Strike site. See epicenter
map for detailed view.
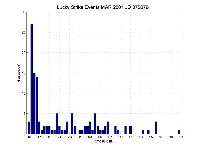
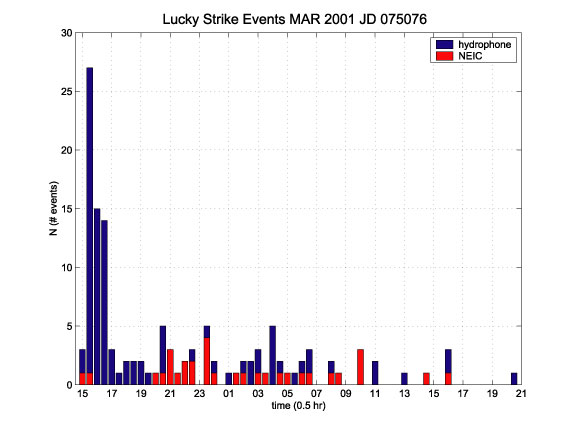
Histogram
showing the half-hourly number of seismic events during
the swarm. Click
for full-size image.
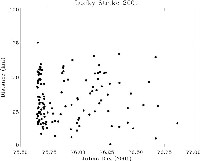
Plot
of the along-strike distance versus time does not indicate
the clear migration of epicenters associated with lateral
dike injection, but shows that the entire segment responded
to the magmatic activity.
Text
of upcoming InterRIDGE Newsletter article
|
|
| |
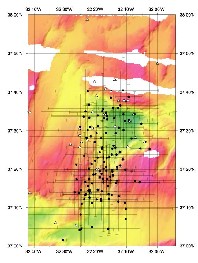
Epicenter
map of the 2001 Lucky Strike earthquake swarm. Click
for full-size images. |
At
about 1530Z on JD 75 (Thursday, March 16, 2001), a seismic
swarm with characteristics of magma dike emplacement was detected
by an array of autonomous underwater hydrophones deployed
by NSF and NOAA investigators in the North Atlantic. The activity
is centered at 37 20'N, 32 15'W on the Lucky Strike Segment
of the Mid Atlantic Ridge, which is also the site of the InterRIDGE
sponsored MoMAR Project. Since the activity lies outside
the array and generally in line with the array geometry, the
locations show somewhat large errors, however in aggregate,
they are clearly centered on Lucky Strike segment and appear
to have originated near the volcanic edifice in the central
rift valley.
| |
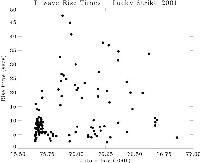
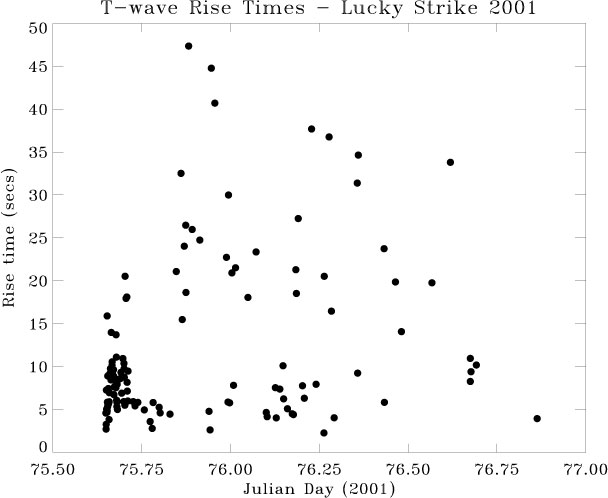
This
diagram shows the change in rise times (time period from
onset to peak for each earthquake) throughout the event.
The cluster of short-rise-time events at the beginning
of the sequence locates near the volcanic edifice at the
Lucky Strike site |
Field
Observations:
Preliminary analysis of in situ observations of the Lucky
Strike hydrothermal field obtained from submersible dives
during July 2002 suggest an increase in diffuse venting, especially
along the sides and base of the black smoker mounds, since
the site was last visited in 1997 (Tim Shank, pers. com.).
However, no evidence of recent lava flows has yet been observed,
and all pre-existing hydrothermal vents appear to still be
intact.
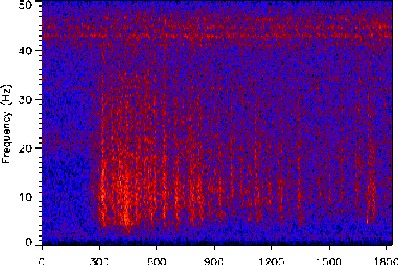
The
spectrogram of the initial 30 minutes of seismic activity
shows the typical character of mid-ocean ridge magmatic seismicity:
intense low-magnitude seismicity with accompanying continuous
tremor and no large main shock
|
|


