1999 Tropical Storm Summary Products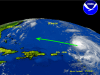
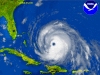
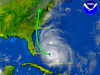
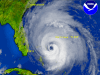
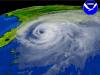
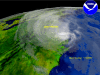
| Hurricane FLOYD, 1999/09/10 at 1545Z.
Latitude:
Longitude:
Data Elements: Hurricane FLOYD, 1999/09/10 at 1545Z from GOES East infrared imagery. TPC
72-hour forecast track. Valid through 1999/09/13 1200Z.
Observation Device: GOES East infrared 4km imagery.
View our larger 1280 X 960
picture! |
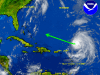
| Hurricane FLOYD, 1999/09/10 at 1545Z.
Latitude:
Longitude:
Data Elements: Hurricane FLOYD, 1999/09/10 at 1545Z from GOES East infrared imagery. TPC
72-hour forecast track. Valid through 1999/09/13 1200Z.
Observation Device: GOES East infrared 4km imagery.
View our larger 1280 X 960
picture! |
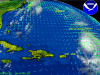
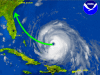
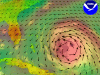
| Hurricane FLOYD, 1999/09/10 at 1545Z.
Latitude:
Longitude:
Data Elements: Hurricane FLOYD, 1999/09/10. Imagery from GOES East at 1545Z. Wind directional
arrows are from 1999/09/10, 0000Z AVN model run.
Observation Device: GOES East infrared, 4km imagery. AVN model output.
View our larger 1280 X 960
picture! |
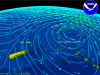
| Hurricane FLOYD, 1999/09/10 at 1545Z.
Latitude:
Longitude:
Data Elements: Hurricane FLOYD, 1999/09/10. Wind arrow indicators and wind streamlines
are from 1999/09/10, 0000Z AVN model.
Observation Device: AVN model, 1999/09/10, 0000Z.
View our larger 1280 X 960
picture! |
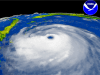
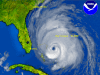
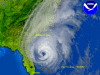
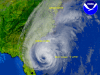
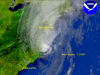
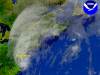
| Hurricane FLOYD, 1999/09/13 at 1345Z.
Latitude:
Longitude:
Data Elements: Hurricane FLOYD, 1999/09/13 at 1345Z, 4km infrared imagery from GOES East.
Observation Device: GOES East, 4km infrared imagery.
View our larger 1280 X 960
picture! |
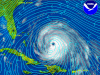
| Hurricane FLOYD, 1999/09/13 at 1345Z.
Latitude:
Longitude:
Data Elements: Hurricane FLOYD, 1999/09/13 at 1345Z with 72 hr TPC forcast overlay.
Observation Device: GOES East, 4km infrared imagery.
View our larger 1280 X 960
picture! |
| Hurricane FLOYD, 1999/09/13 at 1345Z.
Latitude:
Longitude:
Data Elements: 3D view of Hurricane FLOYD approaching Miami, Florida as of 1999/09/13 at 1345Z.
Observation Device: GOES East, 4km infrared imagery.
View our larger 1280 X 960
picture! |
| Hurricane FLOYD, 1999/09/13 forecast comparison.
Latitude:
Longitude:
Data Elements: Hurricane FLOYD imagery is from GOES East, 1999/09/13 at 1345Z. Streamlines showpredicted position of storm by AVN model output created on 1999/09/13, 0000Z.
Observation Device: GOES East, 4km infrared imagery. AVN model output.
View our larger 1280 X 960
picture! |
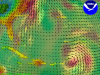
| Hurricane FLOYD, 1999/09/13 humidity analysis.
Latitude:
Longitude:
Data Elements: Colored fields indicate relative humidity. Red represents 100% RH and blue
represents 40% RH. Black arrows indicate wind direction and speed. Underlying
imagery is GOES East, 1999/09/13 at 1345Z.
Observation Device: AVN model output from 1999/09/13 at 0000Z. GOES East, 4km infrared imagery.
View our larger 1280 X 960
picture! |
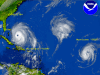
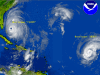
| Hurricanes FLOYD and GERT, 1999/09/13 at 1715Z.
Latitude:
Longitude:
Data Elements: Hurricanes FLOYD and GERT, 1999/09/13 at 1715Z. Imagery is from GOES East.
Observation Device: GOES East, 4km infrared imagery.
View our larger 1280 X 960
picture! |
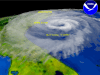
| Hurricane FLOYD, 1999/09/14 at 1245Z.
Latitude:
Longitude:
Data Elements: Hurricane FLOYD, 1999/09/14 at 1245Z. Imagery is from GOES East.
Observation Device: GOES East 4km, infrared imagery.
View our larger 1280 X 960
picture! |
| Hurricane FLOYD, 1999/09/14 at 1245Z.
Latitude:
Longitude:
Data Elements: 3D image of Hurricane FLOYD approaching Florida coast. Valid as of 1999/09/14
at 1245Z.
Observation Device: GOES East 4km, infrared imagery.
View our larger 1280 X 960
picture! |
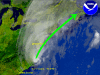
| Hurricane FLOYD, forecast position, 1999/09/14 at 1245Z.
Latitude:
Longitude:
Data Elements: Hurricane FLOYD, 1999/09/14 at 1245Z with 72hr TPC forecast overlay. Arrowhead
represents predicted position on 1999/09/17 at 0900Z.
Observation Device: GOES East, 4km infrared imagery. TPC forecast.
View our larger 1280 X 960
picture! |
| Hurricanes FLOYD and GERT, 1999/09/14 at 1245Z.
Latitude:
Longitude:
Data Elements: Hurricanes FLOYD and GERT, 1999/09/14 at 1245Z. Imagery is from GOES East.
Observation Device: GOES East, 4km infrared imagery.
View our larger 1280 X 960
picture! |
| Hurricane FLOYD, 1999/09/14 at 1445Z.
Latitude:
Longitude:
Data Elements: Hurricane FLOYD, 1999/09/14 at 1445Z. Imagery is from GOES East.
Observation Device: GOES East 4km, infrared imagery.
View our larger 1280 X 960
picture! |
| Hurricane FLOYD, 1999/09/14 at 1745Z.
Latitude:
Longitude:
Data Elements: 3D view of Hurricane FLOYD approaching the Florida coast. Imagery is from GOES
East on 1999/09/14 at 1745Z.
Observation Device: GOES East 4km, infrared imagery.
View our larger 1280 X 960
picture! |
| Hurricane FLOYD, 1999/09/14 at 1745Z.
Latitude:
Longitude:
Data Elements: Hurricane FLOYD approaching the Florida coast. Imagery is from GOES East on
1999/09/14 at 1745Z.
Observation Device: GOES East 4km, infrared imagery.
View our larger 1280 X 960
picture! |
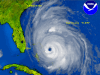
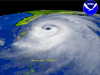
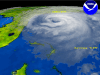
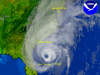
| Hurricane FLOYD, 1999/09/15 at 1315Z.
Latitude:
Longitude:
Data Elements: Overhead view of Hurricane FLOYD approaching US East Coast. Imagery is from
GOES East.
Observation Device: GOES East 4km, infrared imagery.
View our larger 1280 X 960
picture! |
| Hurricane FLOYD, 1999/09/15 at 1315Z.
Latitude:
Longitude:
Data Elements: 3D view of Hurricane FLOYD approaching US East Coast. Imagery is from GOES East.
Observation Device: GOES East 4km, infrared imagery.
View our larger 1280 X 960
picture! |
| Hurricane FLOYD, 48hr forecast, 1999/09/15.
Latitude:
Longitude:
Data Elements: Arrowhead indicates TPC 48hr forecast position of storm. Forecast data is from
1999/09/15 at 0900Z. Imagery is from GOES East on 1999/09/15 at 1315Z.
Observation Device: GOES East 4km, infrared imagery.
View our larger 1280 X 960
picture! |
| Hurricane FLOYD, 1999/09/15 at 1445Z.
Latitude:
Longitude:
Data Elements: 3D image of Hurricane FLOYD off the Florida coast. Imagery is GOES East from
1999/09/15 at 1445Z.
Observation Device: GOES East 4km, infrared imagery.
View our larger 1280 X 960
picture! |
| Hurricane FLOYD, 1999/09/15 at 1445Z.
Latitude:
Longitude:
Data Elements: Overview image of Hurricane FLOYD off the Florida coast. Imagery is GOES East
from 1999/09/15 at 1445Z.
Observation Device: GOES East 4km, infrared imagery.
View our larger 1280 X 960
picture! |
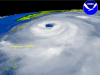
| Hurricane FLOYD, 1999/09/15 at 1715Z.
Latitude:
Longitude:
Data Elements: 3D view of Hurricane FLOYD off the Florida coast. Imagery is from GOES East on
1999/09/15 at 1715Z.
Observation Device: GOES East 4km, infrared imagery.
View our larger 1280 X 960
picture! |
| Hurricane FLOYD, 1999/09/15 at 1715Z.
Latitude:
Longitude:
Data Elements: Overhead view of Hurricane FLOYD off the Florida coast. Imagery is from GOES
East om 1999/09/15 at 1715Z.
Observation Device: GOES East 4km infrared imagery.
View our larger 1280 X 960
picture! |
| Hurricane FLOYD, 1999/09/16 at 1245Z.
Latitude:
Longitude:
Data Elements: 3D view of Hurricane FLOYD. Imagery is from GOES East on 1999/09/16 at 1245Z.
Observation Device: GOES East 4km, infrared imagery.
View our larger 1280 X 960
picture! |
| Hurricane FLOYD, 1999/09/16 at 1245Z.
Latitude:
Longitude:
Data Elements: Overhead view of Hurricane FLOYD on 1999/09/16 at 1245Z. Imagery is from GOES
East.
Observation Device: GOES East 4km, infrared imagery.
View our larger 1280 X 960
picture! |
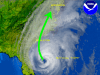
| Hurricane FLOYD forcast, 1999/09/16.
Latitude:
Longitude:
Data Elements: Arrowhead represents storm probable storm position on 1999/09/19 at 0900Z.
Position information from TPC 48hr forecast. Imagery is from GOES East on
1999/09/16 at 1245Z.
Observation Device: GOES East 4km, infrared imagery.
View our larger 1280 X 960
picture! |
| Hurricanes FLOYD and GERT, 1999/09/16 at 1545Z.
Latitude:
Longitude:
Data Elements: Overhead view of Hurricane GERT with relative humidity overlay. Red = 100% RH.
Blue = 40% RH. Black arrows indicate wind speed and direction. Imagery is from
GOES East on 1999/09/16 at 1545Z.
Observation Device: GOES East 4km, infrared imagery. AVN model output.
View our larger 1280 X 960
picture! |
| Hurricane FLOYD, 1999/09/16 at 1545Z.
Latitude:
Longitude:
Data Elements: Overhead view of Hurricane FLOYD on 1999/09/16 at 1545Z. Imagery is from GOES
East.
Observation Device: GOES East 4km, infrared imagery.
View our larger 1280 X 960
picture! |
| Hurricane FLOYD, 1999/09/10 at 1545Z.
Latitude:
Longitude:
Data Elements: Hurricane FLOYD, 1999/09/10 at 1545Z with relative humidity and wind arrow
overlay. Red represents 100% RH, while blue represents approximately 40% RH.
Data obtained from AVN model run 0000Z, 1999/09/10. Underlying imagery is from
GOES East, 1545Z.
Observation Device: AVN model and GOES East 4km infrared imagery.
View our larger 1280 X 960
picture! |