2005 NIGMS Funding Trends
The following data are related to the message from the NIGMS Director in the October 31, 2005, issue of the NIGMS Feedback Loop.
 |
|
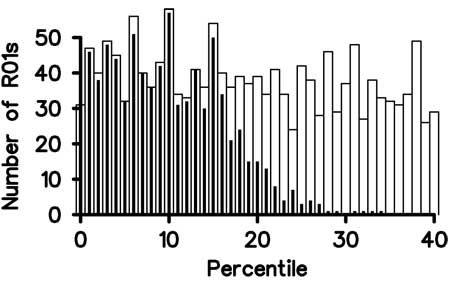
Figure 1a: Total number of applications assigned to NIGMS (in white) and the number of applications funded (in black) versus the percentile score for both new (Type 1) and competing renewal (Type 2) R01 applications in Fiscal Year 2005.

Figure 1b: Total number of applications assigned to NIGMS (in white) and the number of applications funded (in black) versus the percentile score for both new (Type 1) and competing renewal (Type 2) R01 applications in Fiscal Year 2004.
|
 |
|
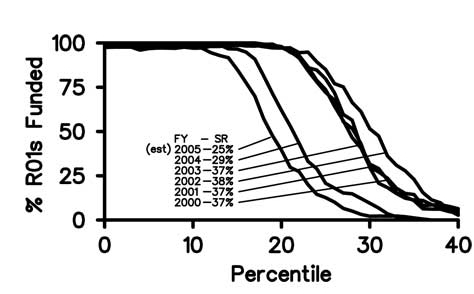
Figure 2: Percentage of R01 applications funded versus the percentile score for Fiscal Years 2000-2005. Also shown are the corresponding published success rates for these years. |
 |
|
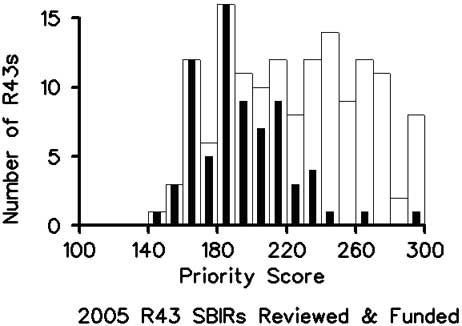
Figure 3: Total number of applications assigned to NIGMS (in white) and the number of applications funded (in black) versus the priority score for Phase I SBIR (R43) grant applications in Fiscal Year 2005.
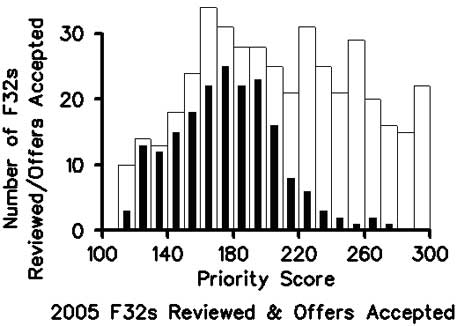
Figure 4: Total number of applications assigned to NIGMS (in white) and the number of applications funded (in black) versus the priority score for NRSA F32 Fellowship grant applications in Fiscal Year 2005. For the better scores (up to 200) some of the offers made by NIGMS to successful F32 applicants were declined. |
 |
|
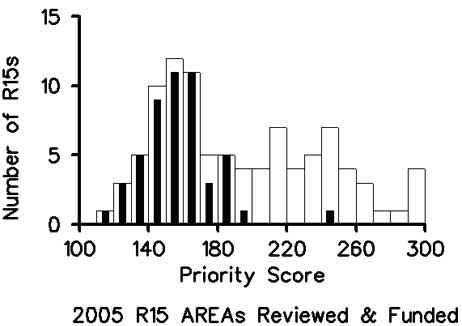
Figure 5: Total number of applications assigned to NIGMS (in white) and the number of applications funded (in black) versus the priority score for AREA (R15) grant applications in Fiscal Year 2005.
|