|
 |
 |
| Home | News | Organization |
|
|
Station List Observations Observations via Google Maps Recent Historical Obs Search Ship Obs Report NOAA Obs APEX DART® MMS ADCP TAO DODS HF Radar OSMC Dial-A-Buoy RSS Feeds Email Access Station Status NDBC Maintenance NDBC Platforms Partner Platforms Program Info About NDBC Met/Ocean Moored Buoy C-MAN TAO DART® VOS CSP IOOS® DAC Publications Hurricane Data Plots Mariners Weather Log Observing Handbook No. 1 Science Education FAQ Contact Us Links |
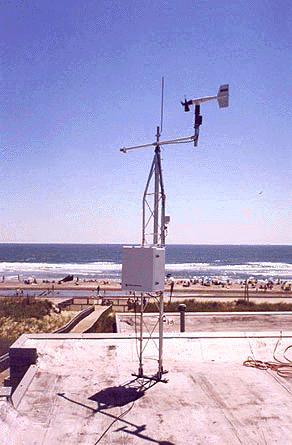
Station AVAN4 - Avalon, NJ
|
||||||||||||||||||||||||||||||||||||||||||||||||||||||||||||||||||||||||||||||||||||||||||||||||||||||||||||||||||||||||||||||||||||||||||||||||||||||||||||||||||||||||||||||||||||||||||||||||||||||||||||||||||||||||||||||||||||||||||||||||||||||||||||||||||||||||||||||||||||||||||||||||||||||||||||||||||||||||||||||||||||||||||||||||||||||||||||||||||||||||||||||||||||||||||||||||||||||||||||||||||||||||||||||||||||||||||||||||||||||||||||||||||||||||||||||||||||||||||||||||||||||||||||||||||||||||||
Owned and maintained by Stevens Institute of Technology Right whales are active off NJ. Speed restrictions of 10 knots apply to vessels 65 feet or greater in specific areas along the mid-Atlantic coast. To learn more about right whales and rules protecting them, go to: http://www.nero.noaa.gov/shipstrike Meteorological Observations from Nearby Stations and Ships |
|
Click on the graph icon in the table below to see a time series plot of the last five days of that observation. | ||
 | Wind Direction (WDIR): | N ( 350 deg true ) |
| Wind Speed (WSPD): | 6.0 kts |
| Wind Gust (GST): | 12.0 kts |
| Atmospheric Pressure (PRES): | 29.79 in |
| Air Temperature (ATMP): | 23.4 °F |
| Wind Chill (CHILL): | 15.1 °F |
| Combined plot of Wind Speed, Gust, and Air Pressure | |
|
| | | | | | | | | | | | | | | ||||
| MM | DD | TIME (EST) | WDIR | WSPD kts |
GST kts |
WVHT ft |
DPD sec |
APD sec |
MWD | PRES in |
PTDY in |
ATMP °F |
WTMP °F |
DEWP °F |
SAL psu |
VIS mi |
TIDE ft | |
|---|---|---|---|---|---|---|---|---|---|---|---|---|---|---|---|---|---|---|
| 01 | 20 | 8:59 pm | NNW | 6.0 | 12.0 | - | - | - | - | 29.77 | +0.04 | 23.7 | - | - | - | - | - | |
| 01 | 20 | 7:59 pm | NNW | 6.0 | 9.9 | - | - | - | - | 29.75 | +0.08 | 23.5 | - | - | - | - | - | |
| 01 | 20 | 6:00 pm | NNW | 4.1 | 9.9 | - | - | - | - | 29.73 | +0.11 | 26.2 | - | - | - | - | - | |
| 01 | 20 | 4:59 pm | N | 8.0 | 14.0 | - | - | - | - | 29.67 | +0.05 | 27.7 | - | - | - | - | - | |
| 01 | 20 | 3:59 pm | N | 8.0 | 15.9 | - | - | - | - | 29.65 | +0.01 | 29.3 | - | - | - | - | - | |
| 01 | 20 | 2:59 pm | N | 8.0 | 15.9 | - | - | - | - | 29.62 | - | 29.8 | - | - | - | - | - | |
| 01 | 20 | 1:59 pm | N | 8.0 | 15.9 | - | - | - | - | 29.62 | -0.09 | 30.6 | - | - | - | - | - | |
| 01 | 20 | 12:59 pm | N | 9.9 | 18.1 | - | - | - | - | 29.64 | -0.08 | 29.7 | - | - | - | - | - | |
| 01 | 20 | 11:00 am | N | 8.0 | 14.0 | - | - | - | - | 29.56 | - | - | - | - | - | - | - | |
| 01 | 20 | 10:59 am | N | 8.0 | 14.0 | - | - | - | - | 29.71 | +0.00 | 27.1 | - | - | - | - | - | |
| 01 | 20 | 9:59 am | N | 8.0 | 15.9 | - | - | - | - | 29.72 | +0.03 | 23.5 | - | - | - | - | - | |
| 01 | 20 | 8:59 am | N | 6.0 | 12.0 | - | - | - | - | 29.74 | +0.05 | 20.7 | - | - | - | - | - | |
| 01 | 20 | 7:59 am | N | 6.0 | 12.0 | - | - | - | - | 29.72 | +0.04 | 19.6 | - | - | - | - | - | |
| 01 | 20 | 6:59 am | N | 6.0 | 12.0 | - | - | - | - | 29.70 | +0.03 | 19.4 | - | - | - | - | - | |
| 01 | 20 | 5:59 am | NNW | 4.1 | 9.9 | - | - | - | - | 29.69 | +0.00 | 20.1 | - | - | - | - | - | |
| 01 | 20 | 4:59 am | NNW | 6.0 | 9.9 | - | - | - | - | 29.68 | -0.02 | 20.5 | - | - | - | - | - | |
| 01 | 20 | 3:59 am | N | 8.0 | 14.0 | - | - | - | - | 29.67 | -0.04 | 21.0 | - | - | - | - | - | |
| 01 | 20 | 2:59 am | N | 6.0 | 12.0 | - | - | - | - | 29.70 | -0.01 | 22.5 | - | - | - | - | - | |
| 01 | 20 | 1:59 am | N | 6.0 | 14.0 | - | - | - | - | 29.70 | +0.00 | 23.9 | - | - | - | - | - | |
| 01 | 20 | 12:59 am | N | 4.1 | 9.9 | - | - | - | - | 29.71 | +0.00 | 25.0 | - | - | - | - | - | |
| 01 | 19 | 11:59 pm | NNW | 6.0 | 9.9 | - | - | - | - | 29.71 | +0.02 | 25.5 | - | - | - | - | - | |
| 01 | 19 | 10:59 pm | NW | 1.9 | 4.1 | - | - | - | - | 29.71 | +0.04 | 27.0 | - | - | - | - | - | |
| 01 | 19 | 9:59 pm | N | 1.9 | 4.1 | - | - | - | - | 29.70 | - | 28.4 | - | - | - | - | - |
Links which are specific to this station are listed below:
Real Time Data in tabular form for the last forty-five days.
Historical Data & Climatic Summaries for quality controlled data for the current month, previous months, and previous years.
| U.S. Dept. of Commerce National Oceanic and Atmospheric Administration National Weather Service National Data Buoy Center 1007 Balch Blvd. Stennis Space Center, MS 39529 Feedback Page last modified: January 15, 2009 |
Disclaimer Credits Glossary |
Privacy Policy About Us Career Opportunities |