Appendix G: Calculating Exposure Doses
The environmental guidelines (e.g., environmental media evaluation guides [EMEGs], reference dose media evaluation guides [RMEGs], and cancer risk evaluation guides [CREGs]), presented in Appendix F, provide one method for selecting contaminants that need to be further evaluated for their potential impact on public health. Applying the screening analysis, you conduct a direct comparison of substance concentrations detected at a site to environmental guidelines, as described in Chapter 7 of this manual.
Environmental guidelines, however, are derived using default exposure assumptions and may not represent site-specific conditions. To conduct screening using site-specific information, you estimate doses and compare these doses to appropriate health guidelines (e.g., minimal risk levels [MRLs] and reference doses [RfDs]). This appendix describes in detail the equations and methods used when estimating doses and conducting a health guideline comparison, as discussed in Chapter 7. Default exposure parameters (e.g., exposure rates and durations) are presented for illustrative purposes. However, depending on site-specific exposure conditions, alternate parameters may be selected to reflect more realistic exposure estimates.
This appendix addresses dose calculations for exposure to chemical substances, and not radiation or radionuclides. Many complex factors must be considered when estimating radiation doses, therefore, you should consult with a health physicist when radiation or radionuclides are a concern at a site.
The following generic equation (1) in Exhibit 1 is used to estimate the exposure dose resulting from contact with a contaminated medium:
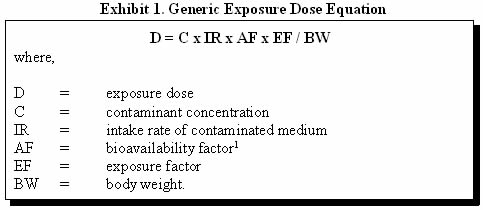
In many instances, the exposure factor (EF) will equal 1—representing a daily exposure to the contaminant. However, some exposure may occur on an intermittent or irregular basis. For these kinds of exposures, an EF can be calculated to average the dose over the exposure interval. The EF is calculated by multiplying the exposure frequency by the exposure duration (ED) and dividing by the time period during which the dose is to be averaged (Exhibit 2).

For example, if a child comes into contact with contaminated soil twice a week during a 5-year period, the exposure factor would be:
EF = (F x ED) / AT
EF = ([2 days/week x 52 weeks/year] x 5 years) / (5 years x 365 days/year)
EF = 0.28
The use of an exposure factor gives the dose averaged during the period of exposure. When daily exposures are occurring, the length of time used for the exposure duration (ED) in the numerator will be incorporated in the denominator. However, because some health effects may not depend on the average dose but rather on the peak dose or some other measure of the dose rate, the length of time in the denominator may change. For example, if exposure is being derived for a carcinogen, the time period during which the dose is averaged may be a lifetime (e.g., instead of 5 years, 70 years would be used in the denominator).
The site-specific exposure conditions will determine what values you should use in the exposure dose equation. The U.S. Environmental Protection Agency's (EPA's) Exposure Factors Handbook (1997) is a good source for locating ranges and percentiles for various exposure information that may be relevant to the site being evaluated. The key to calculating the most accurate exposure dose is to identify values that specifically relate to the exposure situation being assessed. If site-specific information is not available, several conservative exposure assumptions can be applied.
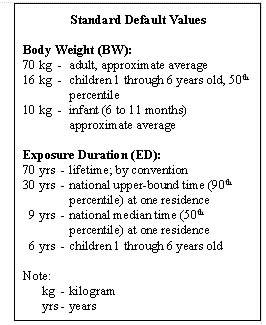
Some standard default values that may be useful in estimating exposures are shown in the text box below (2). You should remember that, if a chemical concentration exceeds an EMEG, an RMEG, a CREG, or a dose calculated using the standard default values, it will also exceed the MRL, RfD, or target risk level.
 The following discussion provides an overview of the
quantitative evaluation of human exposure through the
following pathways: water ingestion, dermal contact,
and inhalation (Section 1); soil ingestion, dermal
contact, and dust inhalation (Section 2); air inhalation
and dermal contact (Section 3); and food ingestion
(Section 4).
The following discussion provides an overview of the
quantitative evaluation of human exposure through the
following pathways: water ingestion, dermal contact,
and inhalation (Section 1); soil ingestion, dermal
contact, and dust inhalation (Section 2); air inhalation
and dermal contact (Section 3); and food ingestion
(Section 4).
Note that estimating an exposure or administered dose as described in the sections below does not take into account the relatively complex physiological and chemical processes that occur once a substance enters the body. Depending on the exposure situation being studied, you may need to qualitatively consider additional factors through the in-depth analysis discussed in Chapter 8. This additional evaluation is particularly appropriate when determining the public health significance of an estimated exposure dose that exceeds an existing health guideline. The in-depth analysis will allow you to gain a better understanding of what is known (and not known) about the likelihood that a particular exposure will result in a harmful effect.
1.0 DRINKING WATER (GROUNDWATER AND SURFACE WATER)
Ingestion of contaminated water is often the most significant source of exposure to hazardous substances from a site. However, various studies indicate that when certain chemicals, such as volatile organic compounds (VOCs), are present in the water, inhalation and dermal exposures can make a significant contribution to the total exposure dose. The magnitude of these exposures varies depending on the frequency of showering and bathing, time spent indoors, air exchange rates in the bathroom and house, and other factors. Although a precise estimate of exposures by these non-ingestion pathways will seldom be available, it may be estimated that non-ingestion exposures could yield a contaminant dose that is comparable to the ingestion dose.
1.1 Ingestion
Ingesting contaminated water is one of the most significant exposure pathways at a site. To estimate exposure to a contaminant from the ingestion of potable water, analyzing contaminant concentrations in tap water samples from individual homes is preferred. Data collected from private wells or municipal wells may also be used. In the absence of data from drinking water supplies, you may consider using data from monitoring wells to estimate upper limits for exposures to contaminants.
Site-specific information, such as the climate in which the exposure is occurring, will enable you to calculate a more accurate exposure dose for the particular situation being evaluated. For example, if exposure doses are being calculated for a person in a more tropical climate, the intake rates may need to be increased because people in hotter climates tend to drink more water than the default value often used. More importantly, realize that the default intake rate of 2 L/day represents intake of fluids from all sources. As such, assuming the default intake rate suggests all fluids are from a single drinking water source.
Exhibit 3 illustrates how exposure doses via drinking water can be estimated and provides default values that may be used when site-specific information is not available (3).
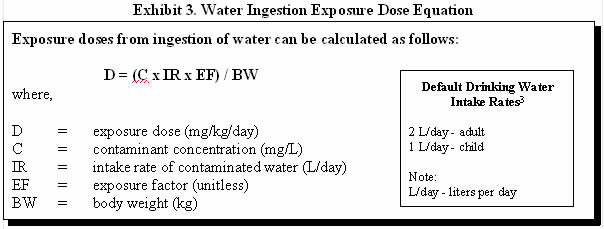
For example, consider human exposure to a water supply contaminated with 35 milligrams per liter (mg/L) methylene chloride. To calculate an adult exposure dose using default values, you would assume a body weight of 70 kilograms (kg), a water intake rate of 2 liters per day (L/day), and daily exposure:
D = (C x IR x EF) / BW
D = (35 mg/L x 2 L/day x 1) / 70 kg
D = 1 milligrams of chemical per kilogram body weight per day (mg/kg/day)
For children, you could assume an average weight of 10 kg, a water intake rate of 1 L/day, and daily exposure:
D = (C x IR x EF) / BW
D = (35 mg/L x 1 L/day x 1) / 10 kg
D = 4 mg/kg/day
In some cases, you may be asked to evaluate exposures during swimming or recreational activities in swimming pools or surface water bodies. Generally, water intake under such scenarios is considered nominal. However, doses can be estimated by using the water ingestion exposure dose equation (Exhibit 3) and using an intake rate of 50 milliliters per hour or swimming event (EPA 1989).
1.2 Dermal Contact
Dermal absorption of contaminants in water occurs during bathing, showering, or swimming and may be a significant route of exposure depending on the substance-specific characteristics. The permeability of the skin to a chemical is influenced by the physicochemical properties of the substance, including its molecular weight (size and shape), electrostatic charge, hydrophobicity, and solubility in aqueous and lipid media. In general, chemicals that demonstrate high skin permeability are low in molecular weight, non-ionized, and lipid soluble.
Chemical-specific permeability coefficients should be used to estimate dermal absorption of a chemical from water. Values for dermal permeability coefficients may vary over a large range, depending on the chemical. Part E of the Risk Assessment Guidance for Superfund, Supplemental Guidance for Dermal Risk Assessment (EPA 2001) provides available dermal permeability coefficients for some chemical substances. When the permeability coefficient for a chemical is known, the dermal absorption of a chemical from water can be estimated.
Before using a dermal permeability coefficient, the original reference should be checked to ensure the applicability of the experimental study. For example, dermal permeability coefficients derived from animal studies may not be applicable for human assessment purposes because of substantial differences in skin permeability. In some studies, the permeability coefficients were determined using neat liquids (liquids that have not been mixed or diluted) or concentrated aqueous solutions; exposure of skin to high concentrations of organic solvents can damage the skin, which can profoundly alter the skin's permeability.
Another factor to consider when calculating exposure doses from dermal contact is the exposure frequency and duration. When calculating exposure doses from contact with surface waters, you should consider geographic factors, such as proximity or availability of surface waters for recreation, seasonal factors, and age.
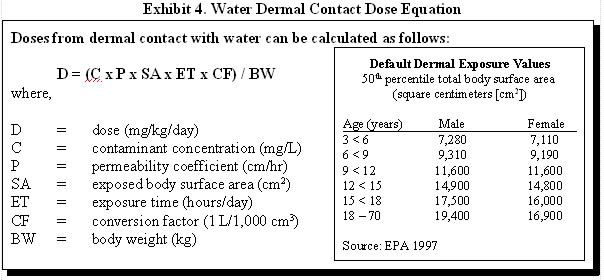
Exhibit 4 illustrates how exposure doses via dermal contact with water can be estimated and provides default dermal exposure values that can be used when the entire body is exposed. Remember that when only parts of the body are exposed, surface areas for those specific body parts should be used. EPA's Exposure Factors Handbook (1997) is a good source for additional body part surface areas.
1.3 Inhalation
|
As a health assessor, you should also recognize the potential for inhalation of volatile organic compounds (VOCs) that escape from water used in the home. Experimental studies have demonstrated that VOCs can be efficiently transferred from water to air, especially in showers where the water is heated and there is a large water-air interface.
VOCs released to the air can equilibrate with the air in the bathroom and eventually with the rest of the house. Modeling has been used to calculate the concentration of VOCs in air in various parts of the house as a result of VOC release during indoor water use. These data, in combination with time-activity profiles of residents, have been used to estimate indoor air exposures to VOCs.
The models and studies applied to predict exposures expected to result from inhalation of VOCs have reported varying results, based on chemical-specific properties and exposure conditions. The varied findings across experimental studies underscores the difficulty in characterizing this exposure pathway. Remember that actual exposures depend on number of factors, such as chemical concentration, extent of ventilation, length of shower, among others. A few examples follow.
In some model shower experiments, about 40–60% of tricholoroethylene (TCE) in water was volatilized to the air, depending on water temperature and other factors (Andelman 1985). A one-compartment exposure model used by Maslia et al. (1996) indicated that exposure to TCE by inhalation during shower is nearly identical to that of ingesting water contaminated with TCE. Xu and Weisel (2003) found that inhalation exposures to the particulate phase of disinfection byproducts during showering are less than 1% of the ingestion dose, whereas vapor-phase haloketonic exposures under the same scenario represent more than 10% of the ingestion dose. The ratio of 3:4:3 for ingestion, inhalation, and skin absorption exposures to chloroform during a 10-minute shower has been shown to change to a ratio of 1:7:2 when the shower duration is increased to 20 minutes (Kuo et al. 1998). Lin and Hoang (2000) reported that the combined inhalation exposure to trihalomethanes during showering and cooking was comparable to the exposure dose from direct ingestion. McKone (1989) applied three-compartment model to estimate concentrations of VOCs in a shower, bathroom, and remainder of a house. Applying modeling results, household-inhalation uptake were shown to be 1 to 6 times higher than ingestion uptake for VOCs (McKone 1989). Regardless of the variation in their findings, most researchers indicate that inhalation to volatile chemicals can be an important exposure route.
In addition to using modeling as a method to determine indoor air concentrations of chemicals, researchers have also conducted field studies measuring tap water concentrations and resulting airborne concentrations. For example, Jo et al. (1990a and b) provide measured shower air data associated with water contaminated with chloroform—their measurements showing an equal risk associated with ingestion and inhalation exposures. Be aware that application of a conservative screening model using comparable water concentrations could predict air concentrations more than10 times greater than those measured in these particular studies.
Air concentrations of VOCs released from the water can be estimated by applying models or by searching available literature to identify chemical-specific field studies. Using either method, however, requires an understanding of the model and/or study limitations, as discussed in Chapter 5. Once a concentration is estimated, the air inhalation Exposure Dose Equation (Exhibit 7) in Section 3.1 can be used to calculate exposure doses.
VOCs, after being inhaled, can be absorbed by the respiratory epithelium and transported throughout the body by systemic blood circulation. Respiratory absorption of VOCs is influenced by the concentration in the air, breathing rate, and the duration of exposure.
2.0 SOIL (SURFACE SOIL AND SEDIMENT)
2.1 Ingestion
|
Both use of and accessibility to the site and surrounding areas must be considered when evaluating a site's soil exposure pathways. Sites with abandoned buildings, standing water, or streams may attract children, and exposures may occur at sites near playgrounds or school yards despite fencing and other efforts to restrict access. Both residential and recreational areas are likely to provide access for exposure. Contaminated soil can be brought into homes on the feet of family members and pets. Suspended soil particulates in outdoor air can also enter a house through indoor-outdoor air exchange. A young child playing on the floor will have the maximum opportunity both for ingestion and for dermal exposure to soil and dust accumulated on the floor.
Exhibit 5 illustrates how exposure doses via ingestion of soil can be estimated and provides some default soil intake rates for various age groups.
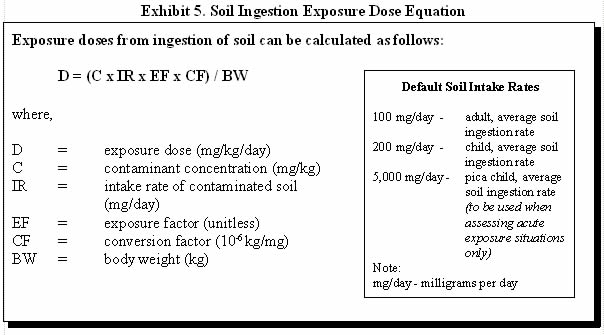
For example, consider adult ingestion of soil with a non-carcinogenic contaminant concentration of 100 milligrams per kilogram (mg/kg) and a daily soil ingestion rate of 100 milligrams per day (mg/day). Assume the person is on site 5 days per week, 50 weeks per year, for 30 years. First calculate the exposure factor:
EF = (F x ED) / AT
EF = ([5 days/week x 50 weeks/year] x 30 years) / (30 years x 365 days/year)
EF = 0.68
Next calculate the exposure dose:
D = (C x IR x EF x CF) / BW
D = (100 mg/kg x 100 mg/day x 0.68 x 10⁻⁶ kg/mg) / 70 kg
D = 9.7 x 10⁻⁵ mg/kg/day
2.2 Dermal Contact
As a health assessor, you must acknowledge the potential for exposure by dermal absorption of chemicals from contaminated soil (5). Dermal absorption of contaminants from soil or dust depends on the area of contact, the duration of contact, the chemical and physical attraction between the contaminant and the soil, and the ability of the contaminant to penetrate the skin. Chemical-specific factors, such as lipophilicity, polarity, volatility, molecular weight, and solubility also affect dermal absorption. (6)
For most exposure scenarios, ATSDR generally considers dermal exposure to be a minor contributor to the overall exposure dose relative to contributors from ingestion and inhalation. Many organic chemicals bind to organic matter in soil, and are therefore not readily available for absorption by the skin. In addition, only the fraction of the contaminant that is in direct contact with the skin is amenable to absorption. Therefore, the ability of a soil contaminant to be dermally absorbed depends on the diffusion of the contaminant through the soil matrix.
|
Another factor to consider when calculating exposure doses from dermal contact is the exposure frequency and duration. Young children (2.5 years), older children, and adults are expected to have different exposure frequency and duration. Young children would have an increased exposure frequency because they tend to retain soil on their skin after coming indoors. Adults would have a decreased exposure frequency because they tend to have less time to be exposed to outdoor soil (EPA 1997).
Exhibit 6 illustrates how soil dermal absorbed doses can be estimated and provides default dermal exposure values.
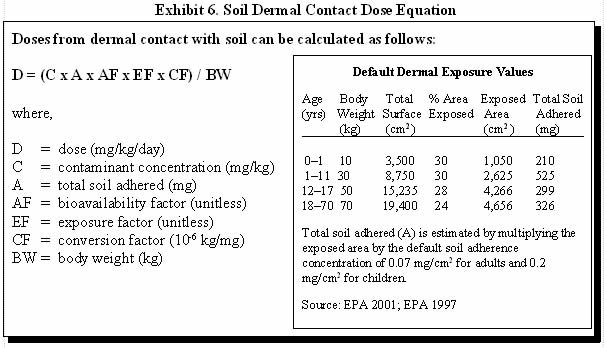
For example, one can calculate the estimated average daily exposure dose for a child that has been exposed to a soil contaminant at a concentration of 100 mg/kg every day from birth through 11 years of age. Assume that the average exposed skin surface area during this time is 30% and the bioavailability for the contaminant is 0.1.
First calculate the exposure factor for age 0–1:
EF = (F x ED) / AT
EF = (365 days/year x 1 year) / (11 years x 365 days/year)
EF = 0.09
Then calculate the exposure factor for age 1–11:
EF = (F x ED) / AT
EF = (365 days/year x 10 years) / (11 years x 365 days/year)
EF = 0.91
Next calculate the dose:
D = [exposure for age 0–1] + [exposure for age 1–11]
D = [(C x A x AF x EF x CF) / BW] + [(C x A x AF x EF x CF) / BW]
D = [(100 mg/kg x 210 mg x 0.1 x 0.09 x 10-6 kg/mg) /10 kg] + [(100 mg/kg x 525 mg
x 0.1 x 0.91 x 10-6 kg/mg) / 30 kg]
D = (0.00002 mg/kg/day) + (0.00016 mg/kg/day)
D = 0.00018 mg/kg/day
2.3 Dust Inhalation
As the health assessor, you should also consider the inhalation of dusts from contaminated soils. In both children and adults, the dose of a soil contaminant that results from oral ingestion is likely to exceed the dose resulting from dust inhalation (Hawley 1985). However, for contaminated dusts, chemicals that have specific toxic effects on the respiratory tract (e.g., chromium and lung cancer) may require special concern. When there is a special concern about a contaminant in dust, the air inhalation Exposure Dose Equation (Exhibit 7) in Section 3.1 can be used to calculate exposure doses.
3.0 AIR
3.1 Inhalation
Inhalation is an important pathway for human exposure to contaminants that exist as atmospheric gases or are adsorbed to airborne particles or fibers. Inhalation exposure to contaminants from hazardous waste sites can occur as a result of direct release of gases and particles from an on-site facility, volatilization of gases from contaminated soils or water bodies, or resuspension of dust and particles from contaminated soil surfaces. When assessing exposure to atmospheric gases, generally, the estimation of inhaled dose is not necessary. The doses in the toxicological literature are reported as concentrations that can be directly compared to concentrations measured at a site. Inhalation rates are taken into account when studying dose-response relationships and in developing the screening values. (7) A dose calculation may be necessary when considering exposure to contaminants adhered to dust and inhaled.
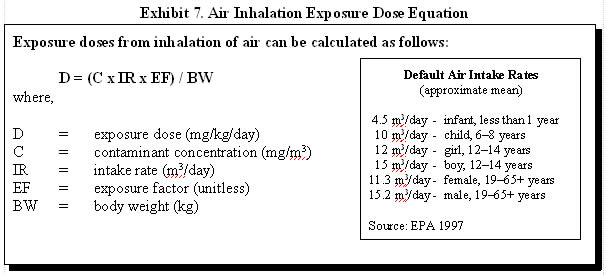
Exhibit 7 illustrates how inhalation exposure doses can be estimated and provides default air intake rates. A person's activity level, physical condition, gender, and age are a few factors that will influence the air intake rate.
3.2 Dermal Contact
Dermal exposure to some air contaminants could also result in absorption through the skin. However, data are not likely to be available to quantitatively estimate exposures from this pathway. Nevertheless, you should acknowledge potential exposure pathway for air contaminants that can be readily absorbed through the skin.
4.0 FOOD CHAIN (BIOTA)
4.1 Ingestion
Assessment of the human health risk from ingestion of contaminated food requires information on the quantities of contaminated foodstuffs consumed and the extent of contamination present in foodstuffs. The most reliable method of assessing the extent of human exposure to contaminants in food is direct measurement of concentrations in foodstuffs. Such measurements should be conducted on foodstuffs prepared for consumption or portions of contaminated plants and animals that are representative of those portions used as food.
If the food chain appears to be a significant pathway for human exposure and the appropriate information on contaminant levels is not available, that lack of information should be explicitly identified in the public health assessment and a recommendation should be made that the appropriate information be obtained. When making this recommendation, consider the substances found at the site and understand the substances' tendencies to bioaccumulate in animals or plants so that you may recommend the most appropriate strategy for obtaining necessary information.
Estimation of exposure dose through food chains requires knowledge of the consumption rate of specific food items in the human diet. EPA's Exposure Factors Handbook (1997) provides intake rates for a variety of foodstuffs. You should be aware that consumption rates of the population in the vicinity of a hazardous waste site may differ considerably from national average consumption rates. For example, regional consumption rates of beef may vary widely from national averages. Consumption rates of subpopulations within the contaminated area may also vary significantly from the national averages. For example, people such as American Indian or Alaska Natives who subsist on fish from a primary source would likely have an increased consumption rate. When local consumption patterns are available and are different from national averages, they should be used in the calculations to determine exposure doses.
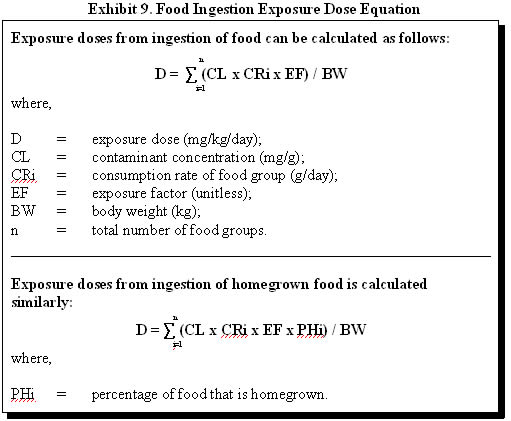
Most commonly, as a health assessor, you are concerned about exposures from consuming fish that have bioaccumulated a substance found in surface water or sediment. Typically, you will assume that all fish consumed are caught from one contaminated water body. Exhibit 8 illustrates how fish ingestion exposure doses can be estimated. If the exposed population is consuming fish from multiple sources, however, the equation presented in Exhibit 9 should be used.
As a conservative estimate, this example does not consider contaminant reduction due to cooking. Cooking fish prior to eating can reduce the levels of some substances. You can review scientific literature to identify how cooking may affect the substance under evaluation. For example, studies have shown a 20-70% reduction of some lipophilic substances (e.g., polychlorinated biphenyls [PCBs]) in fish as a result of cooking (Sherer and Price 1993; Wilson et al. 1998).
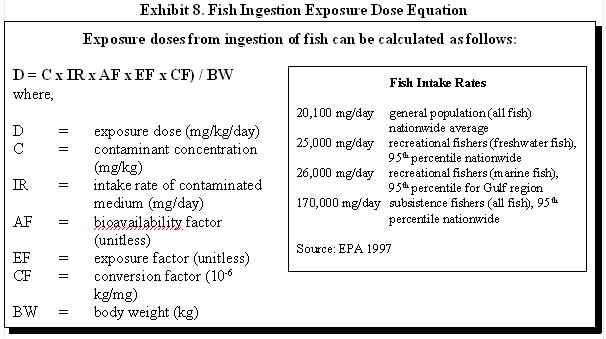
For example, consider an adult who is a recreational fisher at a nearby lake and ingests 25,000 mg/day of fish with a non-carcinogenic contaminant concentration of 100 mg/kg. The fish intake rate is a daily average, so the exposure factor is equal to 1. To calculate the exposure dose:
D = C x IR x EF x CF) / BW
D = (100 mg/kg x 25,000 mg/day x 1 x 10⁻⁶ kg/mg) / 70 kg
D = 3.57 x 10⁻² mg/kg/day
In the case of residential soil contamination, the consumption rate of homegrown foods and local wild plants is also of interest. To estimate the total daily intake of a particular contaminant that may bioaccumulate in multiple foodstuff, daily intakes of contaminants from all affected foodstuffs should be considered. Exhibit 9 illustrates how food ingestion exposure doses can be estimated.
The following example illustrates the calculation of the food ingestion exposure dose for cadmium through garden crop contamination. The consumption rates and percentage of foods that are homegrown were obtained from EPA's Exposure Factors Handbook (1997).
| Food | CL (mg/g) |
CR(8) (g/day) |
PH (%) |
EF | BW (kg) |
Exposure
dose (mg/kg/day) |
| Potatoes | 0.02 | 65.6 | 3.8 | 1 | 70 | 0.0007 |
| Dark green vegetables | 0.01 | 10.8 | 4.4 | 1 | 70 | 0.00007 |
| Deep yellow vegetables | 0.51 | 8.8 | 6.5 | 1 | 70 | 0.004 |
| Tomatoes | 0.24 | 52.6 | 18.4 | 1 | 70 | 0.03 |
| Other vegetables | 0.01 | 79.0 | 6.9 | 1 | 70 | 0.0008 |
| Total | 0.036 | |||||
Thus, the daily human exposure dose of cadmium from contaminated garden produce in this example is estimated to be 0.036 mg/kg/day. Estimates should be confirmed, as necessary, by a local consumption survey.
References
Andelman JB. 1985. Inhalation exposure in the home to volatile organic contaminants of drinking water. Science of the Total Environment 1985 Dec;47:443-60.
ATSDR. 2001. Summary report for the ATSDR soil-pica workshop. June 2000, Atlanta, Georgia. Atlanta: US Department of Health and Human Services. March 20, 2001. Available at: http://www.atsdr.cdc.gov/child/soilpica.html.
EPA. 1989. Risk assessment guidance for Superfund. Volume I: human health evaluation manual (Part A). Interim Final. EPA/540/1-89/002. December 1989.
EPA. 1997. Exposure factors handbook. Volumes 1, 2, and 3. Available at: http://www.epa.gov/ncea/pdfs/efh/front.pdf. ![]()
EPA. 2001. Risk assessment guidance for Superfund. Volume I: human health evaluation
manual. Part E, supplemental guidance for dermal risk assessment: Interim. Review Draft--For
Public Comment. EPA/540/R/99/005. September 2001. Available at: http://www.epa.gov/oerrpage/superfund/programs/risk/ragse/index.htm.![]()
Finley BL, Kerger BD, Dodge DG, Meyers SM, Richter RO, Paustenbach DJ. 1996. Assessment of airborne hexavalent chromium in the home following the use of contaminated tapwater. J Expo Anal Environ Epidemiol. 1996 Apr-Jun;6(2):229-45.
Hawley JK. 1985. Assessment of health risk from exposure to contaminated soil. Risk Anal 5(4):289-302.
Jo WK, Weisel CP, Lioy PJ. 1990a. Chloroform exposure and the health risk associated with multiple uses of chlorinated tap water. Risk Analysis 1990 Dec;10(4):581-5.
Jo WK, Weisel CP, Lioy PJ. 1990b. Routes of chloroform exposure and body burden from showering with chlorinated tap water. Risk Analysis 1990 Dec;10(4):575-80.
Kuo HW, Chiang TF, Lo IL, Lai JS, Chan CC, Wang JD. 1998. Sci Total Environ. 1998 July 11;218(1):1-7.
Lin TF, Hoang SW. 2000. Inhalation exposure to THMs from drinking water in south Taiwan. Sci Total Environ. 2000 Jan 31;246(1):41-9.
Maslia JL, Aral MM, Williams RC, Williams-Fleetwood S, Hayes LC, Wilder LC. Use of computational models to reconstruct and predict trichloroethylene exposure. Toxicol Ind Health. 1996 Mar-Apr;12(2):139-52.
McKone TE. 1989. Household exposure models. Toxicol Lett 1989 Dec;49(2-3):321-39.
Sherer and Price. 1993. The effect of cooking processes on PCB levels in edible fish tissue. Qual Assur 1993 Dec;2(4):396-407.
Wilson ND, Shear NM, Paustenbach DJ, Price PS. 1998. The effect of cooking practices on the concentration of DDT and PCB compounds in the edible tissue of fish. J Expo Anal Environ Epidemiol 1998 Jul-Sep;8(3):423-40.
Xu X, Weisel CP. 2003. Inhalation exposure to haloacetic acids and haloketones during showering. Environ Sci Technol. 2003 Feb 1;37(3):569-76.
2 The standard default values shown in the box are exposure assumptions that ATSDR uses when calculating comparison values. According to EPA's Exposure Factors Handbook (1997), the average adult body weight is 71.8 kilograms (kg), the average infant (6–11months) body weight is 9.1 kg, and the 90th percentile for the length of time a person lives at one residence is 33 years.
3 The default values are exposure assumptions that ATSDR uses when calculating drinking water comparison values. According to EPA's Exposure Factors Handbook (EPA 1997), the average adult and child (1–10 years) water intake rates are 1.4 L/day and 0.74 L/day, respectively. The 90th percentile drinking water intake rates for an adult and child are 2.3 L/day and 1.3 L/day, respectively.
4 The degree of soil-pica behavior varies widely in the population, and is influenced by nutritional status and the quality of care and supervision. Groups at risk of exhibiting soil-pica behavior include children 6 years old and younger and developmentally delayed individuals. ATSDR generally uses an intake rate of 5,000 mg/kg when evaluating soil-pica exposures. This value is believed to represent a conservative estimate based on available studies (ATSDR 2001).
5 Direct dermal contact with soil contaminants may provoke dermal sensitization reactions based on chemical reactivity or allergic sensitivity. These types of sensitivity reactions result from direct skin contact with the chemical sensitizer and are not dependent on dermal absorption of the contaminant. There is large intra-individual variability in dermal sensitization reactions. Therefore, this type of sensitization reaction is not considered in the comparison values for soil or other environmental media.
6 In addition to the multiple factors one needs to consider when evaluating the extent of dermal absorption, health assessors should also recognize the limitations of applying dermal toxicologic data to site-specific scenarios. While informative to the process, much of the data depend on animal studies with repeated applications of relatively high doses of pure substance directly on the skin of the test animal. This information needs to be put into the context of site-specific exposures. The data may not be directly applicable to short periods of human contact with soil, for example.
7 Note that IRIS employs a default inhalation rate of 20 m3/day, which is greater than the recommended default in EPA's Exposure Factor Handbook and presented in PHAGM.
8 CR was converted to g/day from g/kg-day by multiplying by 60 kg (EPA 1997).
Agency for Toxic Substances and Disease Registry, 1825 Century Blvd, Atlanta, GA 30345
Contact CDC: 800-232-4636 / TTY: 888-232-6348