
|
Dust Control Technology for Asphalt Milling (Northeast) |
 |
National Institute for Occupational Safety and Health
IN-DEPTH SURVEY OF DUST CONTROL TECHNOLOGY FOR ASPHALT MILLING
At
Northeast Asphalt, Inc.
US Route 22 and SR 64 Projects, Wisconsin
With assistance from The National Asphalt Pavement Association Silica Partnership
REPORT WRITTEN BY:
Alan Echt
Alberto Garcia
Stanley Shulman
Jay Colinet
Andrew Cecala
Rebecca V. Carlo
Jeanne Zimmer
REPORT DATE: January 2007
REPORT NO: EPHB 282-12a
U.S. DEPARTMENT OF HEALTH AND HUMAN SERVICES
Centers for Disease Control and Prevention
National Institute for Occupational Safety and Health
Division of Applied Research and Technology
Engineering and Physical Hazards Branch
4676 Columbia Parkway, Mail Stop R-5
Cincinnati, Ohio 45226-1998
SITES SURVEYED:
Northeast Asphalt, Inc.
US 22 and SR 64 Projects,
Wisconsin
SIC CODE: 1611 (Highway and Street Construction)
SURVEY DATE: July 13-15, 2004
SURVEY CONDUCTED BY:
Alan Echt, NIOSH/DART
Stanley Shulman, NIOSH/DART
Rebecca V. Carlo, NIOSH/DART
Jay Colinet, NIOSH/PRL
Andrew Cecala, NIOSH/PRL
EMPLOYER REPRESENTATIVE CONTACTED:
Tony Bodway
Payne & Dolan, Inc.
ACKNOWLEDGMENT
The authors thank the National Asphalt Pavement Association Silica Partnership, the manufacturer of this milling machine, and Northeast Asphalt for their efforts on behalf of this study and for their assistance in arranging this site visit.
ABSTRACT
A study was performed to evaluate the effectiveness of water spray controls for a cold-milling machine. The objective of this study was to quantify the exposure reduction that could be achieved through the use of higher water flow rates during pavement milling. The effectiveness of the dust controls examined in this study was evaluated by measuring the reduction in the respirable dust and respirable quartz exposures in personal and area samples collected during a typical milling job. Increasing the water flow to the cutter drum spray bars from about 5 gpm to about 9 gpm and from approximately 2 gpm to around 3 gpm at the conveyor sprays resulted in an overall reduction in respirable dust emissions of about 50%, and nearly as great a reduction in respirable quartz emissions. Those results varied by location, with the greatest reduction occurring at the conveyor sampling location.
INTRODUCTION
The National Institute for Occupational Safety and Health (NIOSH) is located in the Centers for Disease Control and Prevention (CDC), part of the Department of Health and Human Services (DHHS). NIOSH was established in 1970 by the Occupational Safety and Health Act, at the same time that the Occupational Safety and Health Administration (OSHA) was established in the Department of Labor (DOL). The OSH Act legislation mandated NIOSH to conduct research and education programs separate from the standard-setting and enforcement functions conducted by OSHA. An important area of NIOSH research deals with methods for controlling occupational exposure to potential chemical and physical hazards.
The Engineering and Physical Hazards Branch (EPHB) of the Division of Applied Research and Technology (DART) has been given the lead within NIOSH to study and develop engineering controls and assess their impact on reducing occupational illness. Since 1976, EPHB (and its predecessor, the Engineering Control Technology Branch) has conducted a large number of studies to evaluate engineering control technology based upon industry, process, or control technique. The objective of each of these studies has been to evaluate and document control techniques and to determine their effectiveness in reducing potential health hazards in an industry or for a specific process.
The primary aim of this project is to determine if the engineering controls supplied with new milling machines and operated according to the manufacturers’ recommendations are adequate to control worker exposures to respirable dust and respirable crystalline silica (in the form of quartz). The long term goal of this project is to reduce worker exposures to silica by providing data to support the development of a set of best practice guidelines for the equipment if the engineering controls are adequate, or to develop a set of recommendations to improve the performance of controls if they are not adequate.
Many construction tasks have been associated with overexposure to crystalline silica [Rappaport et al. 2003]. Among these tasks are tuck pointing, concrete sawing, concrete grinding, and abrasive blasting [NIOSH 2000, Thorpe et al. 1999, Akbar-Kanzadeh and Brillhart 2002, Glindmeyer and Hammad 1988]. Road milling has also been shown to result in overexposures to respirable crystalline silica [Linch 2002, Rappaport et al. 2003, and Valiante et al. 2004]. However, all three of those road-milling studies are limited because they do not provide enough information about the operating parameters and engineering controls present on the milling machines to determine if the overexposures were due to a lack of effective controls or poor work practices. This study will attempt to fill that knowledge gap.
A variety of machinery and work practices are employed in asphalt pavement recycling, including cold-planers, heater planers, cold-millers, and heater-scarifiers [Public Works 1995]. Cold-milling, which uses a toothed, rotating drum to grind and remove the pavement to be recycled, is primarily used to remove surface deterioration on both asphalt and Portland cement concrete road surfaces [Public Works 1995]. The milling machines used in cold-milling are the focus of this investigation.
The cold-milling work observed during this site visit was typical “mill and fill” preventive maintenance work. According to the engineering contractor, the work on Route 22 was set up to mill off about 1 inch of the existing asphalt pavement to correct the super elevations and rutting. There were 4 to 6 inches of existing asphalt pavement over 10 to 12 inches of aggregate base. The road had moderate rutting and cracks. Based upon the condition of the road, the engineering contractor estimated that the road was last paved about 20 years ago. The contractor salvaged the milled material and used some of it in the mix that was used in repaving the road [Beardslee 2004].
This study was facilitated by a partnership in cooperation with the National Asphalt Pavement Association that includes milling machine manufacturers, contractors, employee representatives, NIOSH, and other interested parties.
OCCUPATIONAL EXPOSURE TO CRYSTALLINE SILICA
Silicosis is an occupational respiratory disease caused by inhaling respirable crystalline silica dust. Silicosis is irreversible, often progressive (even after exposure has ceased), and potentially fatal. Because no effective treatment exists for silicosis, prevention through exposure control is essential. Exposure to respirable crystalline silica dust occurs in many occupations, including construction. Crystalline silica refers to a group of minerals composed of silicon and oxygen; a crystalline structure is one in which the atoms are arranged in a repeating three-dimensional pattern [Bureau of Mines 1992]. The three major forms of crystalline silica are quartz, cristobalite, and tridymite; quartz is the most common form [Bureau of Mines 1992]. Respirable refers to that portion of airborne crystalline silica that is capable of entering the gas-exchange regions of the lungs if inhaled; this includes particles with aerodynamic diameters less than approximately 10 µm [NIOSH 2002].
When proper practices are not followed or controls are not maintained, respirable crystalline silica exposures can exceed the NIOSH Recommended Exposure Limit (REL), the OSHA Permissible Exposure Limit (PEL), or the American Conference of Governmental Industrial Hygienists (ACGIH) Threshold Limit Value (TLV) [NIOSH 2002, 29 CFR 1910.1000, ACGIH 2006]. The NIOSH recommended exposure limit is 0.05 mg/m3, in order to reduce the risk of developing silicosis, lung cancer, and other adverse health effects.
The OSHA PEL for respirable dust containing 1% quartz or more in general industry is expressed as an equation [29 CFR 1910.1000]:
| Respirable PEL = | 10 mg/m3 % Silica + 2 |
If, for example, the dust contains no crystalline silica, the PEL is 5 mg/m3, and if the dust is 100% crystalline silica, the PEL is 0.1 mg/m3. For tridymite and cristobalite, OSHA uses half the value calculated using the formula for quartz [29 CFR 1910.1000].
The current OSHA permissible exposure limit (PEL) for respirable dust containing crystalline silica (quartz) for the construction industry is measured by impinger sampling. The PEL is expressed in millions of particles per cubic foot (mppcf) and is calculated using the following formula [29 CFR 1926.55]:
| Respirable PEL = | 250 mppcf % Silica + 5 |
Since the PELs were adopted, the impinger sampling method has been rendered obsolete by gravimetric sampling [OSHA 1996]. OSHA is not aware of any government agencies or employers in this country that are currently using impinger sampling to assess worker exposure to dust containing crystalline silica, and impinger samples are generally recognized as being less reliable than gravimetric samples [OSHA 1996]. OSHA has determined that sampling procedures in the construction industry should be the same as in general industry, and that the mppcf PEL in 29 CFR 1926.55(a) is equivalent to the mg/m3 PEL in 29 CFR 1910.1000 [OSHA 1996].
The ACGIH® TLV®s for cristobalite, quartz, and tridymite are all 0.025 mg/m3 [ACGIH 2006].
METHODS
Descriptive data
Descriptive data about the milling machine were gathered during the afternoon and evening prior to the first day of sampling, while the machine was parked near US 22. Information was collected about the number, type, condition, and placement of water spray nozzles on the drum and at the conveyor belt transitions; the cutter drum rotation rate; the hours on the machine; the cutter drum condition; and the cutter bits, including their spacing, condition, make, and model number. NIOSH personnel worked with the manufacturer’s representative and a Payne & Dolan crew to install water flow meters and pressure gauges, and inspect, clean or replace the water spray nozzles.
Water flow and pressure
Water flow rate was measured using two digital water flow meters with a range of 2-20 gallons per minute (Series B07, Great Plains Industries, Inc., Wichita, KS) installed in the water supply lines on the mill. One meter was installed in the line between the water pump and the cutter drum spray bar. The second meter was installed in the line between the water pump and the conveyor transition sprays. Water pressure was measured using pressure gauges attached to tee-fittings installed in the water line supplying the cutter drum spray bar, in the water line supplying the spray bar for the first conveyor belt transition, and in the water line supplying the nozzles on the secondary conveyor transition. The readings on these meters and gauges were observed and recorded periodically during milling.
Vehicle speed and direction of travel, productivity
Vehicle speed and direction of travel was measured using a data-logging global positioning system (GPS) receiver (Mobile Mapper, Thales Navigation Inc., Santa Clara, CA). The GPS unit was placed on top of the mill in front of the operator’s station dashboard. Speed was also recorded during both days of milling by a NIOSH researcher observing and periodically recording the foot speed reading on the instrument panel of the mill. The researcher also noted the time when each dump truck was loaded and pulled away from the milling machine as a measure of productivity,
Depth and width of cut, wind speed and direction, temperature
Depth of cut was measured periodically during the milling days using a tape measure held at the edge of the cut pavement. The width of the cut was measured as well. Wind speed and direction and temperature were recorded using a data-logging weather station (Model 05103 Wind Monitor and Model 32500 Electronic Compass / Serial Interface, R. M. Young Co., Traverse City, MI) attached to a guardrail at the operator’s platform.
Work practices and personal protective equipment
The work practices and use of personal protective equipment were recorded for each worker sampled, including the worker’s position and distance relative to the milling machine (e.g., walking alongside, following behind, riding). Information obtained from conversations with workers to determine if the sampling days were typical of the normal work load helped to place the sampling results in proper perspective. Data were recorded describing other operations nearby that generated dust, including the process, its location relative to the milling machine, and whether it was upwind or downwind of the milling machine.
Dust and Silica Sampling Methods
On all three days of sampling, personal breathing zone samples on both members of the milling crew were collected at a flow rate of 4.2 liters per minute (L/min) using a battery operated sampling pump at the employee’s waist connected via flexible tubing to a preweighed, 37-mm diameter, 5-micron (µm) pore-size polyvinyl chloride filter supported by a backup pad in a three-piece filter cassette sealed with a cellulose shrink band in accordance with NIOSH Methods 0600 and 7500, and a cyclone (GK 2.69 Respirable/Thoracic Cyclone, BGI Inc., Waltham, MA) placed in the employee’s breathing zone [NIOSH 1994, HSE 1997].
Area samples were collected on both days of sampling at seven locations on the milling machine using an array of instruments mounted on a metal frame. The locations, which are shown in Figure 1, included the railings on both sides of the operator’s platform, near the level controls on both sides of the mill, near the cutter drum on both sides of the mill, and on the right side near the transition from the primary conveyor to the loading conveyor. The sampling instruments in each array included a light-scattering aerosol photometer (pDR, Thermo Electron Corp., Franklin, MA) with a 10-millimeter (mm) nylon cyclone connected to the inlet via flexible tubing. The pDR was in turn connected via flexible tubing to a battery-operated sampling pump calibrated at a flow rate of 1.7 L/min. A pre-weighed 5-µm pore-size polyvinyl chloride filter supported by a backup pad in a two-piece filter cassette sealed with a cellulose shrink band was placed in line between the pDR and the pump. Also included in each sampling array were two battery-operated sampling pumps, both connected through flexible tubing to a 10-mm nylon cyclone and a pre-weighed, 37-mm diameter, 5-µm pore-size polyvinyl chloride filter supported by a backup pad in a two-piece filter cassette sealed with a cellulose shrink band, in accordance with NIOSH Method 0600.
Additional area samples were collected at those seven locations at a flow rate of 4.2 liters/minute using a battery-operated sampling pump connected via flexible tubing to a pre-weighed, 37-mm diameter, 5-micron (µm) pore-size polyvinyl chloride filter supported by a backup pad in a three-piece filter cassette sealed with a cellulose shrink band in accordance with NIOSH Methods 0600 and 7500, and a cyclone (GK 2.69 Respirable/Thoracic Cyclone, BGI Inc., Waltham, MA) attached to the metal frame.
Gravimetric analysis for respirable particulate was carried out with the following modifications to NIOSH Method 0600: 1) the filters and backup pads were stored in an environmentally controlled room (20±1 ºC and 50±5% relative humidity) and were subjected to the room conditions for at least two hours for stabilization prior to tare and gross weighing, and, 2) two weighings of the tare weight and gross weight were performed [NIOSH 1994]. The difference between the average gross weight and the average tare weight was the result of the analysis. The limit of detection for this method was 0.02 mg.
Crystalline silica analysis of the higher-flow filter and all bulk samples was performed using X-ray diffraction. NIOSH Method 7500 was used with the following modifications: 1) filters were dissolved in tetrahydrofuran rather than being ashed in a furnace; and, 2) standards and samples were run concurrently and an external calibration curve was prepared from the integrated intensities rather than using the suggested normalization procedure [NIOSH 1994]. These samples were analyzed for quartz and cristobalite. The limits of detection for quartz and cristobalite on filters were 0.01 and 0.02 mg, respectively. The limit of quantitation is 0.03 mg for both quartz and cristobalite. The lower-flow filter samples were only analyzed for respirable dust; they were not analyzed for silica.
Bulk samples of the milled pavement were collected on a periodic basis from material left in or next to the cut by the milling machine. The silica content of the pavement was determined through analysis of these samples. The limit of detection for quartz in bulk samples was 0.8%. The limit of quantitation was 2%.
Experimental design
Initial activities on site, such as inspecting and cleaning or installing new water spray nozzles, were devoted to returning the mill to the manufacturer’s specifications. However, due to a repair taking place at the loading conveyor, the nozzles located at the transition from the primary conveyor to the loading conveyor were not inspected, cleaned, or replaced during the initial availability of the mill, and miscommunication among the researchers prevented this from happening during the remainder of the site visit.
In order to assess the impact of increasing the water flow rate on dust control, the mill operator was asked to vary the water flow between the flow rate typically used by the operator and a higher flow rate. The order in which this was done was randomized.
RESULTS AND DISCUSSION
The randomization resulted in the following testing orders: July 13 – long-term trials of high water flow, low water flow, low water flow, and high water flow followed by several brief trials at low water flow and high water flow; July 14 – trials of high water flow, low water flow, and low water flow; July 15 – long-term trials of low water flow and high water flow, followed by short-term randomized pairs of high and low water flow (see the column labeled “water flow condition” in Tables 1-3). Each short-term trial was approximately eight minutes in duration, and each long-term trial lasted approximately 1 ½ to 2 hours. On July 14, milling operations were limited to 2 hours of milling intersections. The data for July 14 was very limited thus it was not included in this report.
Descriptive data
There were 1502 hours of use on this milling machine at the beginning of the site visit. It was equipped with water spray nozzles at three places, including drum spray nozzles, primary conveyor spray nozzles, and material transfer conveying spray nozzles. There were 18 flat fan spray nozzles (UniJet® model 11003 SS, Spraying Systems Co., Wheaton, IL) mounted on a spray bar on the back of the cutter drum housing. This type of nozzle was used at all of the installations on this mill. The first three nozzles on both ends of the cutter drum spray bar were mounted 2 inches (in) apart, the third and fourth nozzle were mounted 3 ¾ in apart, and the remaining nozzles were 5 ½ in apart. The rear of the cutter drum extension was served by a separate spray bar equipped with three nozzles. The first two nozzles were 2 in apart, while the second and third nozzle were 5 ½ in apart. The front of the cutter drum was provided with two spray bars, one on the extension on the right side, and one on the left side. The former held three nozzles, while the latter held 2 nozzles.
As noted previously, the nozzles mounted above the material transfer conveyor at the transition from the primary conveyor were not inspected. All of the other nozzles were inspected and replaced or cleaned and reinstalled on the evening before the first sampling day. This mill was equipped with a spraying system that is rated at 15gpm and 200 psi. The water system had on-the-fly flow adjustment, whereby the operator could increase or decrease flow by turning a knob on the control panel.
The 8 ft 3 in wide cutter drum held 200 Kennametal RP07 bits arranged in a helical coil around the drum. The bits, holders and drum were in good condition. New bits were installed as needed during the next three days.
Water flow and pressure
During the first high-flow trial on July 13, the water flow to the cutter-drum spay bars was 8.00 gallons per minute (gpm). The water flow to the conveyor sprays was 4.27 gpm for that trial. During the subsequent low-flow trials the water flow to the cutter drum spray bars averaged 4.86 gpm (range 4.42 to 5.13 gpm), while the average water flow to the conveyor sprays was 1.82 gpm (range 1.13 to 2.50 gpm). The water flow during the next high-flow trial on July 13 averaged 9.12 gpm to the cutter-drum spray bars (range 8.99 to 9.17 gpm) and 3.00 gpm (range 2.97 to 3.04 gpm) to the conveyor sprays. During the short-term low-flow trial, the average water flow rates were 1.91 gpm to the conveyor sprays and 4.53 gpm to the cutter-drum spray bars. No water flow rates were recorded during the short-term high-flow trials, but the operator was instructed to adjust the flow control to the same position it was in during the previous high-flow trials.
On July 15, the average water flow to the conveyor sprays was 1.88 gpm (range 1.84 to 1.97 gpm) during the low-flow trial and 3.20 gpm (range 3.13 to 3.30 gpm) during the high-flow trial. The average water flow to the cutter-drum spray bars was 4.84 gpm (range 4.70 to 5.00 gpm) during the low-flow trial and 9.04 gpm during the high-flow trial (range 8.72 to 9.50 gpm).
Water pressure readings were recorded intermittently during the milling trials on July 13 and 15. During the first high-flow trial, 105 psi was noted as the water pressure to the cutter drum sprays. The average pressure to those sprays during the two subsequent lowflow trials was 41 psi. During the second high-flow trial, an average pressure of 115 psi was recorded for the cutter drum spray bars. A water pressure of 50 psi was noted for the cutter drum sprays during the short-term low-flow trial. Only two water pressure readings were obtained for the conveyor sprays, for an average of 97.5 psi during the second high-flow trial.
Water pressure readings were recorded on three occasions during the low-flow trial on July 15, for an average of 43 psi to the conveyor sprays and 42 psi to the cutter drum spray bars. Cutter drum spray bar water pressure was recorded twice during the highflow trial on July 15, for an average of 115 psi. Conveyor spray water pressure was not recorded during that trial.
Vehicle speed, productivity
Vehicle speed was noted intermittently from the indicator on the instrument panel of the mill on July 13, and was not recorded on July 15. Speeds of 725 and 759 feet per minute (fpm) were noted during the first high-flow trial on July 13, while speeds of 737 fpm and 726 fpm were noted during the first low-flow trial and second high-flow trial, respectively. Distance traveled and time were recorded continuously by the GPS during both days of testing, and used to derive average speeds during the trials. On July 13, the average speed during the first high-flow trial was 0.8 mph. The average speed during the two subsequent low-flow trials was 0.7 mph on July 13, while the average speed during the second high-flow trial was 0.6 mph. On July 15, the average speed during the lowflow trial was 1 mph and 0.7 mph during the high-flow trial. The discrepancies between the foot speed noted from the instrument panel and the average speed recorded by the GPS derives from the inclusion of periods when the mill was halted in the calculation of average speed.
Productivity was recorded in terms of tons of material milled and miles traveled on both July 13 and 15, and in terms of the number of trucks loaded on July 15. A total of 1720 tons of material were milled on July 13 during nearly 6 miles of milling. On July 15, 699 tons of material was milled during almost 6 miles of milling. This represented 53 haul trucks loaded with milled material, with an average loading time of about 4 minutes per truck.
Depth and width of cut, wind speed and direction, temperature
The milling machine, which was equipped with an 8 ft 3 in drum, made full-width cuts on both July 13 and 15. On July 13 and July 15, the milling depth was noted to be 1 to 1.5 inches.
The average wind speed on the afternoon of July 13 was 3.9 mph (wind speed and direction were not recorded until 1:40 pm due to an instrument cable that was disconnected). The average wind direction was 45 degrees during this period (1:40 to 4:00 pm), a northeast wind. Wind speed and direction on July 15 were recorded from 6:00 am to 11:15 am. The average wind speed for that period was 2.5 mph. The average wind direction was 158 degrees during that time, a south-southeast wind. Wind speed and direction are shown in Figures 2 and 3.
The average temperature during the measurement period of 6:55 am to 4:00 pm on July 13 was 81 degrees Fahrenheit (ºF). The average temperature from 6:00 am to 11:15 am was 69 ºF. It rained lightly for a brief period on the morning of July 13 around 9:00 am, and rained heavily in the afternoon. The air sampling pumps were paused when the afternoon rain arrived, and sampling was discontinued for the day.
Work practices and personal protective equipment
Both milling crewmen wore safety glasses, safety shoes, and traffic safety vests. The operator spent all of his time on the mill, running the mill from the operator's station. The foreman/groundman spent the majority of his time walking alongside the mill, operating the grade controls. The foreman drove a broom with an enclosed cab briefly on the morning of July 13 from about 9:30 to 9:55, but his pump faulted during that period, so that exposure is not reflected in his sampling results.
On July 13, the mill described in this report was milling the far left side of the road. Traffic was passing the mill on the right, on a portion of the road that had been milled in the days prior to this test. The mill in this report was following another mill, separated by a distance of about 200 yards. A broom followed the mill described in this report; the manufacturer’s representative worked with the driver of the broom to ensure that he did not follow too closely. The broom used enough water to wet the swept material.
On July 15, the mill described in this report was the lead mill in the project, and milled the right side of the road, with traffic passing on the left on the portion of the road that had not yet been milled. There were occasions when traffic drove onto the shoulder and generated airborne road dust. Once again, the milling machine manufacturer’s representative worked with the broom driver to ensure that he maintained what seemed to be an adequate separation distance. The broom driver again used enough water to wet the swept material.
Personal breathing zone sample results
Personal breathing zone samples results for July 13 and 15 are presented in Table 1. The samples in Table 1 were collected during the long-term trials. A total of twelve samples were collected, six for the operator and six for the foreman/groundman. Four samples were collected for each employee on July 13, and two were collected for each employee on July 15. Two of the July 13 sampling periods represented long-term high-water-flow trials, and two represented long-term low-water-flow trials. On July 15, there was one long-term high-flow trial and one long-term low-flow trial.
The respirable dust results for the operator ranged from 0.43 mg/m3 during the first highflow trial on July 13, to 2.02 mg/m3 during the first low-flow trial on the same day. The foreman’s respirable dust results ranged from 0.12 mg/m3 during the second high-flow trial on July 13, to 1.02 mg/m3 during the low-flow trial on July 15. Respirable dust concentrations measured in personal breathing zone samples were lower during the highwater- flow trials than during the low-flow trials; on average about 50% lower. However, the samples collected in the operator’s breathing zone during the two low-flow trials on July 13 were 2.02 mg/m3 and 1.31 mg/m3. Eight hour TWA results were not calculated for any of these results, because test conditions were varied throughout both days of sampling. However, if these exposures had continued for eight hours, they would have resulted in respirable dust exposures in excess of the OSHA PEL. When reviewing the data described in Tables 1-3, a brief caveat is warranted. As a rule of thumb, the difference between pre- and post-calibration values for air sampling pumps should be no more than 5%. For the sampling described in Tables 1-3, the average difference was 6.7%, with a range of 2.4% to 12.9 %. The reasons for this result are unknown. The pumps used to collect the personal breathing zone samples on July 15 were within the ±5% range, as was the pump used to collect the area sample on the loading conveyor during the high-flow trial on July 15.
Area sample results for respirable dust are presented in Tables 2 and 3. A total of 42 area samples were collected, representing 6 sets of samples collected at 7 locations on the milling machine. Four of these sets of samples were collected on July 13, and two were collected on July 15. For the 21 area samples collected during high-flow trials over both days, the arithmetic mean respirable dust concentration was 2.97 mg/m3 (σ [standard deviation] 2.2), with a geometric mean of 1.64 mg/m3 (GSD [geometric standard deviation] 3.0), where both standard deviations represent variation between days. Analyses of the 21 area samples collected at 7 locations around the mill during a total of 3 low-flow trials over both days revealed an arithmetic mean respirable dust concentration of 4.44 mg/m3 (GSD 0.33) and a geometric mean concentration of 3.38 mg/m3 (GSD 1.4). The ratio of geometric means of the high-flow samples to the lowflow samples was 0.49, indicating a reduction of about one-half in the respirable dust concentrations when the high water-flow was used. When the results for each location are inspected, the respirable dust concentrations are usually lower during the periods when the higher water-flow was used.
For both personal and area samples, the reductions associated with the high water flow are statistically significant at the 5% significance level for the evaluated mill. On July 13, the high flow geometric mean was 0.64 mg/m3, and the low flow geometric mean was 2.12 mg/m3 for all respirable dust samples. The ratio of high to low flow was 0.30, corresponding to a reduction of 70%. On July 15, the high flow geometric mean was 2.64 mg/m3, and the low flow geometric mean was 3.30 mg/m3, corresponding to a ratio of 0.8, and a reduction of about 20%.
The personal breathing zone sampling results for respirable quartz are also presented in Table 1. Generally, the results were less than the limit of detection or between the limit of detection and the limit of quantitation. It should be noted that in the case of values less than the limit of detection, analyses of these data were performed using the conventional value of LOD/sqrt(2). The samples collected in the operator’s breathing zone during the two low-flow trials on July 13 were 0.17 mg/m3 and 0.12 mg/m3. Eight hour TWA results were not calculated for any of these results, because test conditions were varied throughout both days of sampling. However, if these exposures had continued for eight hours, they would have resulted in quartz exposures in excess of the NIOSH REL.
Examination of the respirable quartz results in the area samples reveals results that ranged from less than the limit of detection to 1.14 mg/m3 for the sample collected at the right side of the loading conveyor during the second low-flow trial on July 13. The sample collected at the left rear position during the first high-flow trial on July 13 was not analyzed for quartz because the respirable dust result for that sample was less than the limit of detection. The arithmetic mean quartz concentration for the high-flow trials was 0.17 mg/m3 (σ 0.0026), with a geometric mean of 0.11 mg/m3 (GSD 1.3). The arithmetic mean quartz result for the low-flow trials was 0.26 mg/m3 (σ 0.14); geometric mean 0.18 mg/m3 (GSD 1.3). When the geometric mean for 20 quartz results for the high-flow trials was compared to that for the 21 quartz results for the low-flow trials, a reduction of about 40% in respirable quartz concentration was noted.
For area samples, the geometric mean exposure reduction associated with the high water flow was statistically significant at the 5% significance level (this applies only to the mill studied on the days sampling was performed). For personal samples, the geometric mean exposure reduction associated with the high water flow was also about 40%. However, this reduction was not statistically significant at the 5 % significance level. This analysis may have been influenced by many sample masses that were less than the limit of quantitation.
When all respirable quartz results are reviewed by date, the geometric mean for high flow was 0.072 mg/m3 and 0.17 mg/m3 for low flow for July 13. The resulting ratio of 0.42 corresponds to a reduction of about 58%. For July 15, the high flow geometric mean was 0.092, compared with a low flow geometric mean of 0.12. The ratio of high to low flow was 0.77, corresponding to a reduction of 23%.
Direct reading respirable dust results
Direct reading sampling, conducted using pDRs at seven locations on the milling machine, resulted in the collection of more than 40,000 data points when the results from both July 13 and July 15 were combined. In order to obtain the logarithm of the data for statistical analyses, a value of 0.001 was added to every zero result. The value 0.001 corresponds to the lowest positive result from a pDR, to one significant digit. In both the high and low-flow settings in each pair on July 13, the results from the left-rear sampling location included greater than 50% zeros. All of the zero readings (56 out of about 1150 readings) for the pDR located at the right side of the cutter drum were obtained during the second long-term high-water-flow trial on July 13. There were no zero readings on July 15.
When all of the pDR results were combined for both days, the arithmetic mean respirable dust concentration for the long-term high-flow trials was 3.3 mg/m3 (σ 2.2). The geometric mean respirable dust concentration for the long-term high-flow trials was 0.45 mg/m3 (GSD 3.1). The two-day combined arithmetic mean respirable dust concentration for the low-flow trials was 5.4 mg/m3 (σ 0.84). The overall geometric mean respirable dust concentration for the low-flow trials was 0.95 mg/m3 (GSD 2.7). The ratio of the high-water-flow to low-water-flow results is the ratio of the geometric means of those sampling periods, 0.47. This indicates that the respirable dust concentrations overall during the long-term high-flow trials were about one-half of those measured during the long-term low-flow trails, or a reduction of about 50%. This result is significant at the 5% level. Taken separately, the geometric mean respirable dust concentration during the high-flow trials on July 13 was 0.20 mg/m3 and 0.47 mg/m3 during the low-flow trials; the resulting ratio shows concentrations about 57% lower during the high-flow trials. On July 15, the geometric mean concentration during the long-term high-flow trials was 1.00 mg/m3, while it was 1.93 mg/m3 during the low-flow long-term trials. The ratio of geometric means indicates that respirable dust concentrations were about 48% lower during the high-water-flow condition.
When the results are compared by sampling location, shown in Figure 4 (first by averaging by pair within each day, then averaging over the entire day, and then obtaining the average over both July 13 and July 15), the arithmetic mean respirable dust concentration for the conveyor sampling location for the long-term high-flow trials was 4.51 mg/m3 (σ 0.78), and the geometric mean concentration was 0.53 mg/m3 (GSD 1.0). For that location, the arithmetic mean respirable dust concentration for the long-term low-flow trials was 9.78 mg/m3 (σ 4.3), while the geometric mean concentration was 1.90 mg/m3 (GSD 1.0). The ratio of the geometric means indicates that the higher water flow rate resulted in a 72% reduction in respirable dust levels at that location.
For the sampler located at the left side of the operator’s platform, the arithmetic mean respirable dust concentration during the long-term high-flow trials was 3.57 mg/m3 (σ 2.7), with a geometric mean concentration of 0.77 mg/m3 (GSD 3.6). At that location, the long-term low-flow trials resulted in an arithmetic mean respirable dust concentration of 4.68 mg/m3 (σ 2.7) and a geometric mean respirable dust concentration of 1.10 mg/m3 (GSD 3.7). These results suggest that the higher water flow rate resulted in a respirable dust concentration about 30% lower than that achieved at the lower flow rate.
Samples collected using the pDR at the left side of the cutter drum indicated that the arithmetic mean respirable dust concentration at that location during the long-term highflow trials was 7.77 mg/m3 (σ 8.2); geometric mean 1.34 mg/m3 (GSD 7.0). During the long-term low-flow trials, the arithmetic mean respirable dust concentration was 9.49 mg/m3 (σ 6.9) with a geometric mean concentration of 2.30 mg/m3 (GSD 5.4). The ratio of geometric means indicates a respirable dust concentration about 40% lower at the higher water flow rate.
Results of sampling performed using the pDR at the left rear position on the milling machine during the long-term high-flow trials revealed an arithmetic mean respirable dust concentration of 1.19 mg/m3 (σ 1.4) with a geometric mean concentration of 0.059 mg/m3 (GSD 62). The arithmetic mean respirable dust concentration at this position during the long-term low-flow trials was 2.04 mg/m3 (σ 1.9) with a corresponding geometric mean concentration of 0.14 mg/m3 (GSD 48). The ratio of the geometric mean respirable dust concentrations suggests that dust levels were about 60% lower during the long-term high-flow trials.
Sampling performed using the pDR at the right side of the operator’s platform produced an arithmetic mean respirable dust concentration of 1.71 mg/m3 (σ 0.59) during the longterm high-flow trials, with a geometric mean of 0.35 mg/m3 (GSD 1.7). During the longterm low-flow trials, sampling in the same location resulted in an arithmetic mean respirable dust concentration of 3.58 mg/m3 (σ 0.57), and a geometric mean respirable dust concentration of 0.74 mg/m3 (GSD 1.9). The ratio of geometric mean respirable dust concentrations indicates that results were about 50% lower during the high-waterflow long-term trials.
The results of the real-time respirable dust sampling performed with the pDR at the right side of the cutter drum show an arithmetic mean respirable dust concentration during the long-term high-flow trials of 2.58 mg/m3 (σ 1.9) and a geometric mean concentration of 0.81 mg/m3 (GSD 1.3). During the long-term low-flow trials, the arithmetic mean respirable dust concentration at the right side of the cutter drum was 4.90 mg/m3 (σ 1.2), with a geometric mean of 1.82 mg/m3 (GSD 1.1). The ratio of the geometric means of the results shows results about 50% lower for the high water flow.
The pDRs used to collect samples at the right rear position on the milling machine showed an arithmetic mean respirable dust concentration of 1.26 mg/m3 and a geometric mean of 0.78 mg/m3. The results during the long-term low-flow trials were an arithmetic mean respirable dust concentration of 1.89 mg/m3, with a geometric mean concentration of 1.31 mg/m3 (note that for this location, only the July 15 data were included since almost all available data for July 13 resulted from the second high-flow trial on that day). A comparison of geometric means reveals that the results were about 40% lower during the period of high water flow.
Analyses of the sampling results of short-term trials included only those periods when haul trucks were active. Also, due to software failure, there were no truck times for July 13. It seems best to use only the short-time data from July 15. The July 15 short-term pairs were based upon seven high and low-flow pairs. For most short-term trials, two trucks were loaded at the specified water flow rate. Approximately eight minutes of data were used at the beginning or end of the single long-term trial to create one additional short-term trial. Thirty seconds of data were removed from the beginning and end of each trial to allow the concentrations to reach a steady state, or to allow for some uncertainty in the time of arrival or departure of the truck. In addition, this same deletion rule was followed if there was a break of more than 30 seconds between the two trucks in the trial.
Since only results for one day are shown, no standard deviations are given. Over all of these short-term high-flow trials over all sampling locations, the arithmetic mean respirable dust concentration was 4.90 mg/m3, with a geometric mean concentration of 1.80 mg/m3. The arithmetic mean respirable dust concentration for the short-term lowflow trials was 5.27 mg/m3, with a geometric mean of 2.06 mg/m3. The ratio of geometric mean concentrations was 0.87, representing a dust reduction of 13%, which is not statistically significant at the 5% level.
For the short-term pDR samples collected at the conveyor, the arithmetic mean respirable dust concentration during the high-flow trials was 5.75 mg/m3, with a geometric mean concentration of 1.24 mg/m3. The arithmetic mean respirable dust concentration at that location during the low-flow trials was 5.31 mg/m3 and a geometric mean of 1.32 mg/m3 The ratio of geometric means, 0.94, indicates about a 6% reduction in the respirable dust concentration during higher water flow trials.
The results from the pDR data collected during the short-term trials at the left side of the operator’s platform indicated that the arithmetic mean respirable dust concentration during the high-flow condition was 5.31 mg/m3, with a geometric mean concentration of 2.79 mg/m3. During the low-flow trials, the values at this location were 7.01 mg/m3, and 3.43 mg/m3, respectively. The ratio of geometric means indicates a reduction of about 19% in the respirable dust concentration.
Short-term pDR results from samples collected at the left side of the cutter drum resulted in an arithmetic mean respirable dust concentration of 13.37 mg/m3 and a geometric mean respirable dust result of 9.65 mg/m3 during the high-flow trials. Results from the short-term low-flow trials revealed an arithmetic mean respirable dust concentration of 11.78 mg/m3 with a geometric mean respirable dust concentration of 8.57 mg/m3. The ratio of high-flow to low-flow geometric means is 1.13, indicating a 13% increase in exposure at the higher flow rate.
Analyses of the pDR data collected at the left rear of the milling machine during short term high-flow trials showed an arithmetic mean respirable dust concentration of 2.50 mg/m3 and a geometric mean concentration of 1.96 mg/m3. These values were 3.25 mg/m3 and 2.41 mg/m3 during short-term low-flow trials at that location. The ratio of high-flow to low-flow geometric means of 0.81 indicates a 19% reduction in exposure.
Results obtained from pDR data collected during short-term trials at the right side of the operator’s platform indicated that the arithmetic mean respirable dust concentration during the high-flow trials was 2.24 mg/m3, with a geometric mean result of 0.48 mg/m3. Sampling with the pDR at that location during the short-term low- water-flow trials revealed an arithmetic mean respirable dust concentration of 3.43 mg/m3 and a geometric mean concentration of 0.63 mg/m3, indicating a 24% exposure reduction at that location.
Data from the pDR used to collect respirable dust samples at the right side of the cutter drum showed that during short-term sampling periods the high-flow arithmetic mean respirable dust concentration was 3.70 mg/m3 and the geometric mean concentration was 1.74 mg/m3. During the low-flow short-term trials, these values were 4.08 mg/m3 and 1.75 mg/m3 respectively. The ratio of high-flow to low-flow geometric means, 0.99, indicates that an exposure reduction of 1% took place at this location during the shortterm high-flow periods.
Short-term pDR results from that right-rear location showed an arithmetic mean concentration of 1.43 mg/m3 during the high-flow periods with a geometric mean of 1.11 mg/m3. The values for the short-term low-flow trials were an arithmetic mean of 2.02 mg/m3 and a geometric mean concentration of 1.52 mg/m3, indicating an exposure reduction of about 27%.
Differences by Side of Machine
The side of the machine that was closest to the center of the road tended to have higher concentrations than the other side, though for neither respirable dust nor for quartz was the difference between sides statistically significant at the 5% level for either day. Whereas on July 13 the right side was closest to the center of the road, on July 15 the left side was closest. It is not known whether the side of the milling machine closest to the center of the road tends to be higher because of the dust produced by passing traffic or because the asphalt may be deeper toward the center of the road.
The area respirable dust samples can be used to model the respirable dust exposure of the workers. A simple model expresses operator exposure as a linear function of the average of the right side and the average of the left-side sample results. Thus, the operator exposure depends on both sides, not just the dominant side.
Bulk sample results
Bulk samples contained 19, 17, and 57% quartz. It is possible that a piece of aggregate was included in the third bulk sample. Due to the high quartz content of the third sample, a 0.5 mg portion of that sample was analyzed, resulting in a limit of detection of 3% and a limit of quantitation of 6% for the analysis of quartz in that sample.
The quartz content in personal breathing zone air samples collected on July 13 ranged from 6% to 13%, with an average of 9% quartz. Quartz in area air samples collected on July 13 ranged from 4% to 13%, with an average of 9% quartz. On July 15, the quartz content of personal breathing zone air samples ranged from 1% to 5%, with an average of 3% quartz. Area air samples collected on July 15 ranged from 3 to 5% quartz, with an average of 4% quartz.
Using Explanatory Variables
In statistical modeling, the variable Y is often referred to as the response variable, while the variables X1, X2, etc. are called explanatory variables, because of their use in explaining the response in Y. Table 4 contains the average results of responses and selected explanatory variables for each of the long-term pairs. For the variables “realtime,” “respirable,” and “quartz,” the averages shown in Table 4 are the geometric means. For the explanatory variables analyzed (respirable dust, quartz, real-time data), the natural log of the geometric mean was used as the response variable, and the best model with an R-square value of at least 0.8 was determined. The best model was considered to be the one with the highest R-square value.
Each of the three best models included a term that represented water flow rate, either at the conveyor or at the cutter. As would be expected, the slopes associated with the water flow variables were always negative: as water flow rate increases the concentration of dust or quartz decreases.
Water Flow Rates Needed to Lower Quartz Exposures
For the operator, even at the higher flow rate, two of the three respirable quartz exposures exceeded the REL of 0.05 mg/m3. For the respirable dust, no personal samples exceeded the OSHA PEL at the high flow rate. The results suggest that higher flow rates produce lower quartz measurements; it would be appropriate to determine how much higher the flow rates need to be in order to lower respirable silica concentrations to levels below the NIOSH REL/OSHA PEL. The model used to extrapolate the quartz concentrations expresses the natural log of the quartz determinations as a linear function of the water flow rates. Separate models were used for the cutter flow rates and the conveyor flow rates.
Table 5 shows the reductions over various sampling locations for increased flow rates at the cutter and conveyor. For example, the average quartz value for the three “high” water flow rates (9gpm) is approximately 0.075 mg/m3. The average predicted value for a cutter flow rate of 13 gpm is 0.038. The ratio 0.038/0.075 = 0.51, shows a 49% reduction.
The estimates in Table 5 are only applicable to the dates that the measurements were collected, and under the evaluated conditions. In addition to these limitations, the results only apply at the 50% confidence level. A higher confidence level would require greater flow rates, and perhaps, with the limited data, it is not worthwhile to speculate. The estimates also assume that the linear relationship can be extended beyond the range of the data. This might be an erroneous assumption. Given all of these limitations, the following predictions could be made based on the model and the data:
- The results based on the conveyor flow rates would require lesser increases to get comparable reductions to the ones obtained on the cutter. On the other hand, the estimated slope from the conveyor model is not statistically significant at the 5% level.
- The two quartz samples for the operator at the high flow rates that exceeded the standard were 0.057 and 0.068 mg/m3 (both on July 13), with an average of 0.063 mg/m3. On average, a 20% reduction would be required to meet the standard of 0.05 mg/m3. Average flow rates of 5 gpm at the conveyor and 11 gpm at the cutter drum would be necessary to achieve the 20% reduction when compared to the concentrations observed at the high flow rate.
- It is important to be aware that these flow rates may or may not be a practical solution.
It is also important to mention that six trials are not sufficient to make good predictions of the flow rates required to reduce respirable silica concentrations below the REL. For future evaluations, it would be beneficial to gather data having more than two flow rate levels.
CONCLUSIONS AND RECOMMENDATIONS
Increasing the water flow to the cutter drum spray bars from about 5 gpm to about 9 gpm and from approximately 2 gpm to around 3 gpm at the conveyor sprays resulted in an overall reduction in respirable dust emissions of about 50%, and nearly as great a reduction in respirable quartz emissions. Those results varied by location, with the greatest reduction occurring at the conveyor sampling location. However, given that the dust samples were collected on two different sections of road, with two different primary wind directions, and with the haul trucks passing the milling machine on different sides during the two days of sampling, an examination of the mean dust levels from all locations may be appropriate. These comparisons were made for all types of sampling and for both the arithmetic and geometric mean data. Figure 5 illustrates the average dust reductions that were calculated. For the personal samples, the data from the operator and foreman were combined. For the area samples, all data from the seven sampling locations were combined. Regardless of sampling technique, these data show that increases in water flow resulted in an overall dust reduction around the milling machine. These differences were statistically significant at the 5% level for the evaluated mill on the two sampled days.
However, when the respirable dust results for the short-term trials are examined, the reduction in exposure during milling (only those times when the mill was loading haul trucks) was not as great (Figure 5), and were not significant at the 5% level. This suggests that the reduction in exposures may depend in this case to some degree on the level of activity rather than the additional water flow. This effect should be examined in greater detail in any subsequent evaluations. Since exposure standards are based upon the average exposure over a shift, the overall reduction may be the more relevant measure, but the designers and users of the dust controls should take this effect into account. Finally, it should be noted that even at the higher water flow rates, respirable dust emissions were quite high at several locations around the milling machine.
REFERENCES
29 CFR 1910.1000 [2001]. Occupational Safety and Health Administration: air contaminants.
29 CFR 1926.55 [2003]. Occupational Safety and Health Administration: gases, vapors, fumes, dusts, and mists.
ACGIH [2006]. Threshold limit values for chemical substances. Cincinnati, OH: American Conference of Governmental Industrial Hygienists.
Akbar-Khanzadeh F, Brillhart RL [2002]. Respirable crystalline silica dust exposure during concrete finishing (grinding) using hand-held grinders in the construction industry. Ann. occup. Hyg. 46:341-346.
Beardslee L (lbeardslee@klengineering.com) [2004] STH 22 project. Private e-mail message to Alan Echt (AEcht@cdc.gov), November 30.
Bureau of Mines [1992]. Crystalline silica primer. Washington, DC: U.S. Department of the Interior, Bureau of Mines, Branch of Industrial Minerals, Special Publication.
Glindmeyer HW, Hammad YY [1988]. Contributing factors to sandblasters' silicosis: inadequate respiratory protection equipment and standards. J Occup Med. 30:917-921.
HSE [1997]. MDHS 14/2. General methods for sampling and gravimetric analysis of respirable and total inhalable dust. Methods for the determination of hazardous substances. Health and safety laboratory. Sudbury, Suffolk, UK: Health and Safety Executive.
Hornung R, Reed L [1990]. Estimation of average concentration in the presence of nondetectable values. Applied Occupational and Environmental Hygiene, 5(1):46-51.
Linch, KD [2002]. Respirable concrete dustCsilicosis hazard in the construction industry. Appl. Occup. and Environ. Hyg. 17: 209B221.
NIOSH [1994]. NIOSH manual of analytical methods. 4th rev. ed., Eller PM, ed. Cincinnati, OH: U.S. Department of Health and Human Services, Public Health Service, Centers for Disease Control and Prevention, National Institute for Occupational Safety and Health, DHHS (NIOSH) Publication No. 94-113.
NIOSH [2000]. Respirable crystalline silica exposures during tuck pointing. Cincinnati, OH: U.S. Department of Health and Human Services, Public Health Service, Centers for Disease Control and Prevention, National Institute for Occupational Safety and Health. DHHS (NIOSH) Publication No. 2000-113.
NIOSH [2002]. NIOSH hazard review: health effects of occupational exposure to respirable crystalline silica. Cincinnati, OH: U.S. Department of Health and Human Services, Centers for Disease Control and Prevention, National Institute for Occupational Safety and Health. DHHS (NIOSH) Publication No. 2002-129.
NIOSH [2003]. Information Circular/2003: Handbook for dust control in mining. Pittsburgh, PA: U.S. Department of Health and Human Services, Public Health Service, Centers for Disease Control and Prevention, National Institute for Occupational Safety and Health, Pittsburgh Research Laboratory. IC 9465. DHHS (NIOSH) Publication No. 2003-147.
OSHA [1996]. Memorandum for regional administrators from: Joseph A. Dear. Subject: special emphasis program (SEP) for silicosis. May 2nd 1996. Appendix F: Permissible Exposure Limits for Construction and Maritime. Retrieved May 24, 2004, from: http://www.osha.gov/Silica/SpecialEmphasis.html
Public Works [1995]. Pavement recycling. Public Works 126: April 15, 1995.
Rappaport SM, Goldberg M, Susi P, Herrick RF [2003]. Excessive exposure to silica in the U.S. construction industry. Ann. occup. Hyg. 47:111-122.
Thorpe A, Ritchie AS, Gibson MJ, Brown RC [1999]. Measurements of the effectiveness of dust control on cut-off saws used in the construction industry. Ann. occup. Hyg. 43:443-456.
Valiante DJ, Schill DP, Rosenman KD, Socie E [2004]. Highway repair: a new silicosis threat. Am J Public Health. 94(5):876-80.
Table 1 – Personal Sample Results by Job
Job |
Water Flow Condition |
Sample Duration (min) |
Respirable Dust (mg/m3) |
TWA Respirable Dust (mg/m3) |
OSHA PEL (mg/m3) |
Respirable Quartz (mg/m3) |
TWA Respirable Quartz (mg/m3) |
|
July 13, 2004 |
||||||
Operator |
Low |
85 |
2.02 |
1.60 |
0.87 |
0.17 |
0.14 |
Low |
125 |
1.31 |
0.12 |
||||
High |
126 |
0.43 |
0.51 |
(0.06) |
(0.06) |
||
High |
96 |
0.61 |
(0.07) |
||||
Foreman |
Low |
61 |
0.57 |
0.57 |
1.05 |
ND |
0.03* |
Low |
124 |
0.58 |
(0.04) |
||||
High |
125 |
0.47 |
0.32 |
(0.04) |
(0.03)* |
||
High |
96 |
0.12 |
ND |
||||
|
July 15, 2004 |
||||||
Operator |
Low |
96 |
1.69 |
1.69 |
1.93 |
(0.06) |
(0.06) |
High |
98 |
1.58 |
1.58 |
(0.05) |
(0.05) |
||
Foreman |
Low |
95 |
1.02 |
1.02 |
1.66 |
(0.05) |
(0.05) |
High |
100 |
0.57 |
0.57 |
ND |
ND |
||
ND indicates a value less than the limit of detection of the analytical method.
Values in parentheses represent results between the limit of detection and limit of quantitation of the method.
*LOD/sqrt(2) substituted for mass in calculations The NIOSH REL for crystalline silica-cristobalite, quartz, tridymite, tripoli (as respirable dust) is 0.05 mg/m3
Table 2 – Area Sample Results by Location, July 13, 2004
Location |
Water Flow Condition |
Sample Duration (min) |
Respirable Dust (mg/m3) |
TWA Respirable Dust (mg/m3) |
OSHA PEL (mg/m3) |
Respirable Quartz (mg/m3) |
TWA Respirable Quartz (mg/m3) |
Operator Platform – Left |
Low |
114 |
3.01 |
2.23 |
0.86* |
0.30 |
0.20 |
Low |
120 |
1.49 |
0.11 |
||||
High |
117 |
1.09 |
0.73 |
0.14 |
0.083* |
||
High |
99 |
0.30 |
ND |
||||
Operator Platform – Right |
Low |
113 |
5.47 |
5.01 |
1.04 |
0.39 |
0.36 |
Low |
119 |
4.57 |
0.33 |
||||
High |
120 |
1.03 |
1.44 |
0.09 |
0.13 |
||
High |
100 |
1.93 |
0.17 |
||||
Cutter Drum - Left |
Low |
116 |
5.24 |
3.38 |
0.86 |
0.50 |
0.31 |
Low |
120 |
1.58 |
0.13 |
||||
High |
126 |
3.48 |
2.34 |
0.37 |
0.24 |
||
High |
91 |
0.78 |
(0.07) |
||||
Cutter Drum - Right |
Low |
102 |
5.08 |
3.97 |
0.83 |
0.53 |
0.41 |
Low |
122 |
3.03 |
0.30 |
||||
High |
139 |
0.92 |
1.13 |
0.069 |
0.11 |
||
High |
98 |
1.44 |
0.18 |
||||
Left Rear |
Low |
117 |
0.68 |
0.61 |
1.03* |
(0.06) |
(0.04) |
Low |
121 |
0.55 |
(0.03) |
||||
High |
46 |
ND |
0.1* |
** |
ND |
||
High |
92 |
0.16 |
ND |
||||
Right Rear |
Low |
111 |
0.96 |
0.97 |
1.04* |
0.078 |
0.075 |
Low |
121 |
0.98 |
0.072 |
||||
High |
140 |
0.17 |
0.21 |
ND |
ND |
||
High |
96 |
0.26 |
ND |
||||
Loading Conveyor - Right |
Low |
108 |
13.66 |
13.10 |
0.89 |
1.09 |
1.12 |
Low |
123 |
12.60 |
1.14 |
||||
High |
128 |
3.13 |
4.17 |
0.37 |
0.47 |
||
High |
100 |
5.50 |
0.60 |
ND indicates a value less than the limit of detection of the analytical method.
Values in parentheses represent results between the limit of detection and limit of quantitation of the method.
*LOD/sqrt(2) substituted for mass in calculations.
** The quartz analysis was not done because the respirable dust sample was less than the limit of detection.
The NIOSH REL for crystalline silica-cristobalite, quartz, tridymite, tripoli (as respirable dust) is 0.05 mg/m3
Table 3 – Area Samples by Location, July 15, 2004
Location |
Water Flow Condition |
Sample Duration (min) |
Respirable Dust (mg/m3) |
OSHA PEL Respirable Dust (mg/m3) |
Respirable Quartz (mg/m3) |
NIOSH REL Quartz (mg/m3) |
Operator Platform – Left |
Low |
96 |
6.21 |
1.68 |
0.18 |
0.05 |
High |
103 |
5.34 |
0.27 |
|||
Operator Platform – Right |
Low |
96 |
3.12 |
1.76 |
0.13 |
|
High |
104 |
2.00 |
(0.06) |
|||
Cutter Drum -Left |
Low |
99 |
8.14 |
1.89 |
0.26 |
|
High |
101 |
12.08 |
0.41 |
|||
Cutter Drum - Right |
Low |
98 |
4.65 |
1.80 |
0.19 |
|
High |
103 |
3.54 |
0.10 |
|||
Left Rear |
Low |
101 |
3.65 |
1.72 |
0.12 |
|
High |
99 |
2.56 |
0.12 |
|||
Right Rear |
Low |
98 |
2.04 |
1.90 |
(0.06) |
|
High |
104 |
1.21 |
(0.05) |
|||
Loading Conveyor – Right |
Low |
85 |
4.89 |
1.64 |
0.23 |
|
High |
87 |
4.78 |
0.16 |
ND indicates a value less than the limit of detection of the analytical method.
Values in parentheses represent results between the limit of detection and limit of quantitation of the method.
Table 4 – Variables Included
Variable |
High July 13, Pair 1 |
Low July 13, Pair 1 |
High July 13, Pair 2 |
Low July 13, Pair 2 |
High July 15, Pair 1 |
Low July 15, Pair 1 |
|
|
|
|
|
|
|
Real-time* (mg/m3) |
0.228 |
0.552 |
0.174 |
0.394 |
1.001 |
1.931 |
Respirable* (mg/m3) |
0.677 |
2.542 |
0.599 |
1.768 |
2.633 |
3.296 |
Quartz* (mg/m3) |
0.089 |
0.207 |
0.059 |
0.136 |
0.092 |
0.12 |
Tons removed |
430 |
400 |
440 |
450 |
366 |
333 |
Flow conveyor (gpm) |
4.27 |
2.01 |
3 |
1.57 |
3.2 |
1.9 |
Flow cutter (gpm) |
8 |
4.94 |
9.12 |
4.76 |
9 |
4.8 |
Water pressure (psi) |
105 |
40 |
115 |
41.7 |
115 |
41.7 |
Temperature (ºF) |
69 |
79 |
86 |
85 |
73 |
64 |
Humidity (%) |
75 |
72 |
54 |
57 |
58 |
72 |
Ground speed (mph) |
0.81 |
0.61 |
0.62 |
0.72 |
0.72 |
1 |
*The tabled results for the three kinds of data are the geometric means of all locations.
Table 5 – Reduction Associated with Higher Water Flow Rates at the Cutter Drums and Conveyor
Location |
Flow (gpm) |
Reduction Quartz Dust (%) |
Drum |
11 |
28 |
Drum |
13 |
49 |
Drum |
15 |
63 |
Drum |
17 |
74 |
Conveyor |
5 |
32 |
Conveyor |
6 |
48 |
Conveyor |
7 |
60 |
Figure 1: Area Sampler Locations, July 13-15, 2004
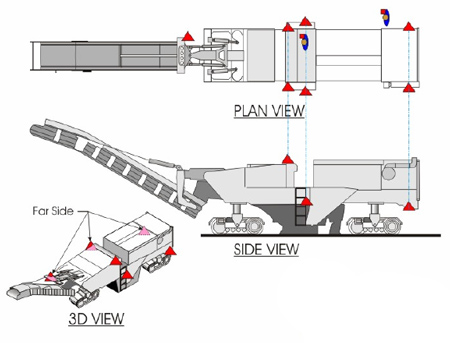
| KEY: | |
| Machine mounted dust monitoring locations | |
| Milling crew dust monitoring locations (shown in plain view only) |
|
Figure 2: Road Milling Wind Data July 13, 2004
Figure 3: Road Milling Wind Data July 15, 2004
Figure 4: Long-Term pDR Direct-Reading Respirable Dust Results Arithmetic Mean and Geometric Mean, by Flow Rate in mg/m3, July 13 & 15, 2004 (Right Rear July 15 only)
Figure 5: Reduction in Dust Levels with High Water Flow
Appendix A. How non-detectable results were used in calculating the respirable dust and quartz concentrations
1) For the July 13 data, if the air sampling results for quartz for one of the trials was nondetectable and the other at that water flow setting was detectable, the non-detectable result was included in both the percent silica calculation and in the TWA calculation after making the (limit of detection [LOD])/sqrt(2) substitution [Hornung and Reed 1990]. The LOD for quartz was 0.01 mg/sample. For instance, for left operator platform on July 13, quartz at the second high flow trial was non-detectable. In the table below, 9.57=100(0.265/2.77) and 0.86=10/(9.57 +2)=0.86 mg/m3
Water level |
Mass resp dust |
Mass quartz |
% quartz |
OSHA PEL |
Hi |
0.52 |
0.0660 |
|
|
Hi |
0.12 |
0.0071 |
|
|
Low |
1.4 |
0.1400 |
|
|
Low |
0.73 |
0.0520 |
|
|
Sum (all trials)= |
2.77 |
0.265 |
9.57 |
0.86 |
For computing TWAs, if a sample was below the limit of detection (LOD) and other samples were above the LOD, LOD/sqrt(2) ==0.01/sqrt(2)=0.0071 (for quartz) was used as the sample mass in the computation. For the right rear data on July 13, the same procedure was used, though both high flow quartz values were less than the limit of detection. In Table 2, the TWA quartz concentration for the right rear data during high flow is shown as “ND”. For the statistical analyses individual determinations (not TWAs) were used, and the above substitution for nondetectable values was used.
2) A more complicated situation is that for the left rear on July 13, when the following values were obtained:
Water level |
Mass resp. dust |
Mass quartz |
% quartz |
OSHA PEL |
Hi |
0.0141 |
** |
|
|
Hi |
0.058 |
0.0071 |
|
|
Low |
0.32 |
0.026 |
|
|
Low |
0.27 |
0.017 |
|
|
Sum (low plus second Hi)= |
0.648 |
0.0501 |
7.73 |
1.03 |
The results for the first high flow trial was dropped in calculating percent quartz, since the sample was not analyzed for quartz. It was not analyzed for silica because the respirable dust mass was less than the silica LOQ. For the non-detectable respirable dust at the first high flow trial the substitution 0.02/sqrt(2) (=0.0141) was made. The LOD for respirable dust was 0.02 mg/sample. For the non-detectable quartz sample at the other high flow setting, the substitution 0.01/sqrt(2)(=0.0071) was made.
![]()
This Survey Report and any recommendations made herein are for the specific facility evaluated and may not be universally applicable. Any recommendations made are not to be considered as final statements of NIOSH policy or of any agency or individual involved. Additional NIOSH Survey Reports are available at http://www.cdc.gov/niosh/surveyreports.
Mention of company names or products does not constitute endorsement by the Centers for Disease Control and Prevention. The findings and conclusions in this report are those of the authors and do not necessarily represent the views of the National Institute for Occupational Safety and Health.
This paper appears in the eLCOSH website with the permission of the author and/or copyright holder and may not be reproduced without their consent. eLCOSH is an information clearinghouse. eLCOSH and its sponsors are not responsible for the accuracy of information provided on this web site, nor for its use or misuse.
![]()
eLCOSH
| CDC | NIOSH
| Site Map | Search
| Links | Help
| Contact Us | Privacy Policy