
|
Back Injuries and Illnesses in Construction and Other Industries (Section 41 of The Construction Chart Book 2nd Edition, September 2002)  |
CPWR – Center for Construction Research and Training
Back injuries in particular, and musculoskeletal disorders (MSDs) in general, result in more days away from work than other types of injuries.1,2 Work-related back injuries and illnesses are caused mainly by repeated lifting of materials, sudden movements, whole body vibration, lifting and twisting at the same time, or bending over for long periods of time. Such health problems are very common in the construction industry, since workers in many construction occupations perform these activities every day. In 2005, construction wage-and-salary workers made up 6.6% of the workforce but accounted for 11% (30,190) of serious back injuries and illnesses for all private industries (270,890). Middle-aged workers who have severe low-back pain and engage in physically demanding work, such as construction, are much more likely to leave the industry due to disability than other workers.3
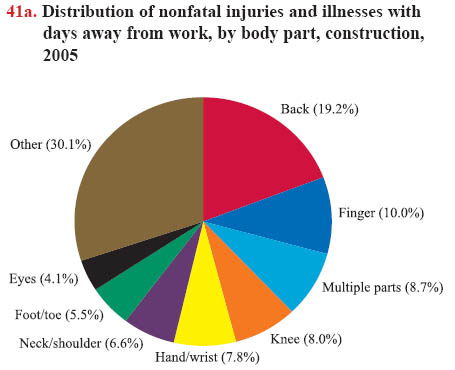
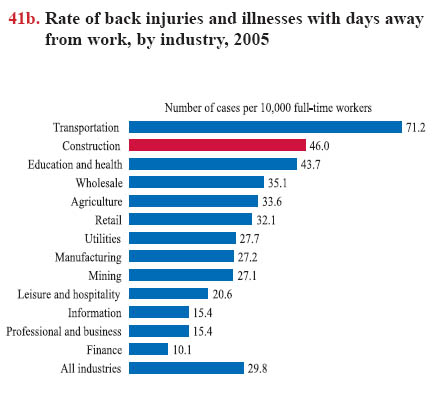
Back injuries account for almost 20% of all nonfatal injuries and illnesses with days away from work in construction (chart 41a). The rate of back injuries in construction is exceeded only by the rate for the transportation industry, and is notably higher than the average rate for all industries (chart 41b).
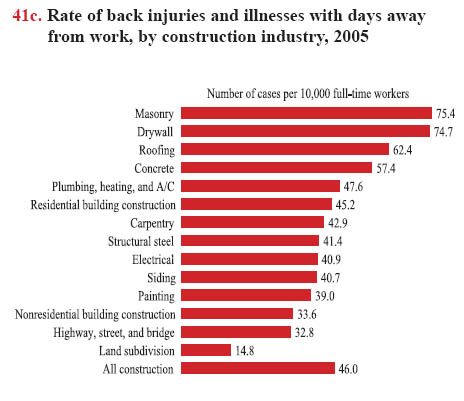
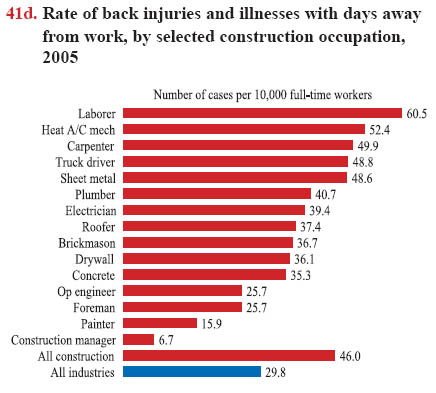
Within construction, masonry workers have the highest rate of back injuries causing days away from work; their rate is about 1.6 times higher than the average rate for all construction workers (chart 41c). Back problems are most common among workers who perform frequent heavy lifting and carrying, such as construction laborers (chart 41d). The statistics reported here are based on the Survey of Occupational Injuries and Illnesses (SOII) conducted by the U.S. Bureau of Labor Statistics (BLS). BLS reports injuries and illnesses together, but in construction, illnesses make up less than 2.5% of the reports. However, occupational illnesses are more likely to be underreported than injuries (see chart book page 32).
Back injuries in construction are expensive. Among all reported injuries in the construction industry, low-back claims are the most frequent and make up the largest proportion of claims costs and days away from work.2,4 The prevalence of back injuries among construction workers is probably even higher than the BLS' numbers indicate, since many injuries are underreported in the construction industry. These data and other research point to the need for developing new strategies to prevent back injuries among construction workers.
Download MS PowerPoint versions of Charts
1. Bert Stover, Thomas M. Wickizer, Fred Zimmerman, Deborah Fulton-Kehoe, and Gary Franklin. 2007. Prognostic Factors of Long-Term Disability in a Workers' Compensation System. Journal of Occupational and Environmental Medicine, 49(1):31-40.
2. Theodore K. Courtney, Simon Matz, and Barbara S. Webster. 2002. Disabling Occupational Injury in the U.S. Construction Industry, 1996. Journal of Occupational and Environmental Medicine, 44(12):1161-1168.
3. Alex Burdorf, Monique H.W. Frings-Dresen, Cor van Duivenbooden, and Lex A.M. Elders. 2005. Development of a Decision Model to Identify Workers at Risk of Long-Term Disability in the Construction Industry. Scandinavian Journal of Work, Environment, and Health, 31(Suppl 2):31-36.
4. Irwin B. Horwitz and Brian P. McCall. 2004. Disabling and Fatal Occupational Claim Rates, Risks, and Costs in the Oregon Construction Industry 1990-1997. Journal of Occupational and Environmental Hygiene, 1(10):688-698.
Source:
Chart 41a - U.S. Bureau of Labor Statistics, 2005 Survey of Occupational Injuries and Illnesses, Table R2, www.bls.gov/iif/oshcdnew.htm (Accessed November 2007).
Charts 41b and 41c - U.S. Bureau of Labor Statistics, 2005 Survey of Occupational Injuries and Illnesses, Table R6, www.bls.gov/iif/oshcdnew.htm (Accessed November 2007).
Chart 41d - U.S. Bureau of Labor Statistics, 2005 Survey of Occupational Injuries and Illnesses, 2005 Current Population Survey. Calculations by CPWR Data Center.
Back to Table of Contents
![]()
This document appears in the eLCOSH website with the permission of the author
and/or copyright holder and may not be reproduced without their consent.
eLCOSH is an information clearinghouse. eLCOSH and its sponsors are not
responsible for the accuracy of information provided on this web site, nor
for its use or misuse.
![]() eLCOSH
| CDC | NIOSH
| Site Map | Search
| Links | Help
| Contact Us | Privacy Policy
eLCOSH
| CDC | NIOSH
| Site Map | Search
| Links | Help
| Contact Us | Privacy Policy