 |
| |
||
| |
|||||||||||||||||
|
|||||||||||||||||
|
|||||||||||||||||
|
EID Home | Ahead of Print | Past Issues | EID Search | Contact Us | Announcements | Suggested Citation | Submit Manuscript PDF
Version | Download Adobe
Acrobat | Comments | |
|
Research Correlating Epidemiologic Trends with the Genotypes Causing Meningococcal Disease, MarylandM. Catherine McEllistrem,* John A. Kolano,* Margaret A. Pass,† Dominique
A. Caugant,‡ Aaron B. Mendelsohn,* Antonio Guilherme Fonseca Pacheco,*
Kathleen A. Shutt,* Jafar Razeq,§ Lee H. Harrison,*† and the Maryland
Emerging Infections Program
Two changes occurred in the epidemiology of meningococcal infection in Maryland during the 1990s. First, meningococcal incidence in persons 15–24 years of age substantially increased and then declined; nearly half of infections in this age group were caused by serogroup C Neisseria meningitidis (1,2). From 1990 to 1997, the incidence increased from 0.9 to 2.1 cases per 100,000 in this age group (p = 0.01) before declining to baseline in the late 1990s. By the mid-1990s, infection in persons 15–24 years accounted for nearly 30% of all meningococcal infections in Maryland, compared to 16% in 1990 to 1991. This increase was caused mostly by sporadic infections. Only three outbreak clusters were recognized, all caused by serogroup C and representing seven total cases with six cases in persons 15–24 years: two cases in 1995 in children aged 12 and 15 years, who lived on the same street; two cases in 1997, in Maryland college students ages 19 and 21 years, and three cases associated with a party in 1999, in young adults ages 18, 20, and 21 years (3). Although the case-fatality rate in persons 15 to 24 years is generally low, during the 1990s, 2.5% of infections in this age group were fatal. The increase in meningococcal incidence in this age group that was observed in Maryland was also seen in other regions of the United States (2). Another change in the epidemiology of meningococcal infection that was observed in Maryland during the 1990s was a substantial increase in both the incidence and proportion of infection caused by serogroup Y stains. For example, the incidence of serogroup Y infection more than doubled, from 0.15 to 0.34 cases/100,000 population/year (p = 0.0009, Cochran-Armitage test for trend), and the proportion of all meningococcal infections of known serogroup caused by serogroup Y strains steadily increased: 24.6% (15/61) in 1992 to 1993, 29.2% (14/48) in 1994 to 1995, 42.5% (34/80) in 1996 to 1997, and 50.0% (35/70) in 1998 to 1999 (p = 0.0009, Cochran-Armitage test for trend). This increase was also statistically significant in both children <15 years of age (p = 0.002) and adults >25 years (0.007); no increase in serogroup Y infection occurred among persons 15–24 years. The molecular epidemiology of N. meningitis infection has historically been addressed by using multilocus enzyme electrophoresis (MEE) (4,5). Because of the complicated nomenclature and labor-intensive nature of electrophoretic type (ET) determination, alternative methods have been sought. Recently, multilocus sequence typing (MLST) of housekeeping genes has been shown to highly correlate with ET (6). Pulsed-field gel electrophoresis (PFGE) has also been shown to be a useful method for discriminating between sporadic and outbreak serotype C strains (7). In this study, we used PFGE and MLST to determine whether the genotypes of N. meningitidis, as identified by PFGE, causing invasive disease correlated with the changes in the epidemiology of infection caused by serogroups C and Y that were observed in Maryland during the 1990s. MethodsActive, laboratory- and population-based surveillance for invasive meningococcal infection from January 1, 1992, to December 31, 1999, that was performed as part of the Maryland Bacterial Invasive Disease Surveillance project (BIDS) was the subject of this analysis (1,8). BIDS is the Active Bacterial Core Surveillance (ABCs) component of the multistate Emerging Infections Program Network coordinated by the Centers for Disease Control and Prevention (CDC) (9). The surveillance case definition was the isolation of N. meningitidis from a normally sterile body fluid specimen from a Maryland resident (1). Meningococcal serogroups were determined by the Maryland Department of Health and Mental Hygiene (DHMH), CDC, and the Norwegian Institute of Public Health using antisera supplied by Difco (Kansas City, MO) and the National Institute for Biological Standards and Control (Potters Bar, UK). The serogroup designation from CDC was used for all but 6 (4%) of 150 isolates. Two isolates were identified as nongroupable by CDC and as serogroup Y by DHMH. Another isolate was identified as serogroup C by CDC and serogroup Y by DHMH. In all three instances, the PFGE pattern was consistent with serogroup Y, and the isolates were therefore classified as such. Two isolates were classified as serogroup C by DHMH but as serogroup B in one case and serogroup Y in another. The PFGE patterns were consistent with those of other serogroup C isolates and therefore these isolates were classified as serogroup C. Finally, one isolate with a PFGE pattern consistent with serogroup Y was classified as serogroup C by both CDC and DHMH. Serogrouping performed at the Norwegian Institute of Public Health with the same subculture as the one used for PFGE identified the isolate as serogroup Y; therefore, this isolate was classified as serogroup Y. PFGEPFGE was performed on 74 serogroup C and 76 serogroup Y isolates as previously described (10). Briefly, equal amounts of bacterial suspension and 2% low melting agarose (Sea Plaque, FMC Bioproducts, Rockland, ME) were pipetted into plug molds and incubated in ESP buffer (0.5 M EDTA, 1% N-lauroyl sarcosine, 1 mg/mL Proteinase K; pH 8.5–9.3) overnight at 50°C. After being washed three times with TE (Tris 0.5 M EDTA) buffer at 37°C, the plugs were restricted with 20 U of NheI (New England Biolabs, Beverly, MA), 330 mg/mL bovine serum albumin, and 200 µl NE Buffer #2 at 37°C overnight. PFGE was performed in a 1% agarose gel by using the following run parameters: 1–30 s for 18 h, 5–9 s for 8 h at 14°C. After the gel was stained with ethidium bromide, the image was digitized on the Bio-Rad Gel Doc 2000 System (Bio-Rad, Hercules, CA). Dendrograms were created with Molecular Analyst/Multi-Analyst programs (Bio-Rad) by using the unweighted pair group method using arithmetic averages (UPGMA), and a position tolerance of 1.5%. The percentage similarity between PFGE patterns was used to assess the relationship between the patterns; PFGE cannot be used to quantify genetic relatedness. The cophenetic correlation, a measure of the correlation between the similarity represented on the dendrograms and the actual Dice coefficient–derived degree of similarity, was calculated for each dendrogram. A minimum 70% correlation is generally considered to be necessary to ensure that the dendrogram accurately represents the similarities between the PFGE patterns. A meningococcal clone was defined as isolates with an indistinguishable PFGE pattern. A PFGE-based clonal group was defined as isolates with a <3-band difference (11) or >80% similarity on dendrogram or both (7). MLSTFourteen serogroup Y and 11 serogroup C strains, selected to represent the range of PFGE patterns identified among our isolates, underwent MLST (Table 1). MLST was performed by using the following seven housekeeping genes (protein products are shown in parentheses): abcZ (putative ATP-binding cassette transporter), adk (adenylate kinase), aroE (shikimate dehydrogenase), fumC (fumarate hydratase) gdh (glucose-6-phosphate dehydrogenase), pdhC (pyruvate dehydrogenase subunit), and pgm (phosphoglucomutase) as previously described (6). The ~470-bp fragments were amplified by polymerase chain reaction (PCR) and sequenced with an ABI Prism 377 (PE Applied Biosystems, Foster City, CA) with 5% Long Ranger Gels (FMC Bioproducts, Philadelphia, PA). DNA sequences were determined on both strands. Sequences were assembled with the Auto Assembler DNA Sequence Software Version 2.0 and consensus sequences compared using Sequence Navigator DNA and Protein Sequence Comparison Software (PE Applied Biosystems). Isolates with >5 alleles identical to sequence type (ST)-11 or ST-23 were defined as belonging to ST-11 or ST-23 complex, respectively (available from: http://neisseria.org/nm/typing/mlst/ [accessed July 4, 2003]). Statistical analyses were performed with SAS (Version 8.2; SAS Institute; Cary, NC) and R for Windows version 1.5.1 (available from: http://cran.r-project.org). Exact tests were performed using StatXact (Version 4.0.1, Cytel Software Corporation; Cambridge, MA). The Dice coefficients were used to perform the pairwise similarity analysis of the serogroup C isolates by age group. In this analysis, the mean and median Dice coefficients were calculated separately for each age group and period, and the distributions of the Dice coefficients among the groups were compared by using the Kruskal-Wallis rank sum test. For each age group, only one isolate from each of the three small outbreak clusters was included in the temporal analyses; however, all isolates were included in the serogroup distribution, description of serogroup C strains in 1998–1999, and the PFGE dendrogram. ResultsDuring the study period, 295 cases of meningococcal infection were reported (1), of which 259 (87.8%) were available for serogroup determination. Among these 259 isolates, 98 (37.8%) were serogroup Y, 86 (33.2%) were serogroup C, 49 (18.9%) were serogroup B, 12 (4.6%) were nonserogroupable, 10 (3.9%) were serogroup W-135, 2 (0.8%) were serogroup Z, and 1 (0.4%) was serogroup X.
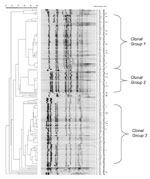
Seventy-eight percent (76/98) of the serogroup Y and 86.0% (74/86) of the serogroup C strains were available for PFGE analysis. The dendrogram of the 150 strains, which had a cophenetic correlation of 87.3%, is shown in Figure 1. Based on the number of band differences and the percent of similarities on the dendrogram, two clonal groups of serogroup Y (arbitrarily designated as clonal groups 1 and 2) and one clonal group of serogroup C (clonal group 3) were noted. Clonal group 1 consisted of 49 serogroup Y strains, clonal group 2 consisted of 21 serogroup Y strains, and clonal group 3 consisted of 57 serogroup C strains. The remaining six serogroup Y strains were designated ”nonclonal 1 or 2 strains,” and the remaining 17 serogroup C strains were designated "not clonal group 3" strains. The proportion of clonal group 2 serogroup Y strains increased from 7.7% (1/13) in 1992 to 1993 to 20.0% (2/10) in 1994–1995,17.9% (5/28) in 1996 to 1997, and 52.0% (13/25) in 1998 to 1999 (p <0.01, exact test for trend). Among the 14 serogroup Y isolates on which MLST was performed (Table 1), clonal group 1 strains belonged to ST-23, ST-1622, or ST-1625 and clonal group 2 belonged to ST-23, ST-1620, and ST-1621. Overall, the serogroup Y clonal group 1 and 2 strains tested belonged to the ST-23 complex. The nonclonal group serogroup Y strains had STs that were not closely related to the ST-23 complex. Among the 74 serogroup C strains, 32 (43.2%) occurred among persons 0–14 years of age, 28 (37.8%) occurred among persons ages 15–24 years, and 14 (18.9%) occurred among adults ages >25 years. Over the 8-year period, 96.0% (24/25) of persons ages 15–24 years were infected with a serogroup C clonal group 3 strain compared to 65.6% (21/32) of persons ages 0–14 years (p < 0.01), and 64.3% (9/14) of adults ages >25 years (p = 0.02). While the incidence was rising from 1992 to 1997 among persons ages 15–24 years, 94.7% (18/19) of persons in this age group were infected with a clonal group 3 strain compared to 57.7% (15/26) of persons ages 0–14 years (p < 0.01) and 60.0% (6/10) of adults ages >25 years (p = 0.04). From 1998 to 1999, the period during which the incidence in persons 15–24 years of age had returned to baseline, 87.5% (7/8) of the serogroup C isolates from this age group were due to a single clone within clonal group 3 (Figure 1). This clone was only detected in 1999 among persons ages 15–24 years, including the three party-associated case-patients (3). Strains from the four other 1999 case-patients that had indistinguishable PFGE patterns from the party outbreak strains were neither epidemiologically linked to the outbreak nor occurred in the month before or after the outbreak. For both the 1995 and 1997 outbreaks, the PFGE patterns of the implicated isolates were indistinguishable within the outbreak, yet distinct from the other strains (Figure 1). All clonal group 3 serogroup C strains that underwent MLST, including strains from the 1997 and 1999 outbreaks, belonged to ST-11 (Table 1). The “not clonal group 3” strains had no alleles in common with ST-11. In the pairwise similarity analysis, serogroup C infection in persons 15–24 years was caused by isolates with more highly-related PFGE patterns than serogroup C isolates from other age groups (Table 2, Figure 2). For example, the median (25th and 75th percentiles) pairwise similarity during 1992 to 1999 for serogroup C isolates that caused infections in persons ages 15–24 years was 87.0% (83.3%; 91.7%), in contrast to 78.3% (63.6%; 87.0%) and 72.7% (64.0%; 81.8%) for persons <15 and >25 years of age, respectively (p < 0.01 for the comparisons of persons 15–24 years versus each of the other two age groups). DiscussionFrom 1992 to 1997, the increasing incidence of invasive meningococcal disease among persons 15-24 years of age was largely caused by a clonal group of serogroup C strains that belonged to the ST-11 complex. These strains had PFGE patterns that were more similar to each other than the serogroup C isolates that were causing infection in the two other age groups. ST-11 (ET-37 complex) has been associated with outbreaks and epidemics (6,7,12). While the meningococcal incidence decreased in this age group in the late 1990s, a unique PFGE-defined serogroup C clone emerged in 1999, which had not been previously detected. Among patients infected with serogroup Y isolates, a shift occurred from one ST-23 complex Y clonal group to another over time. The risk for meningococcal infection depends on a variety of strain, host, and environmental factors (13). During epidemics, which are generally clonal, the proportion of cases that occur in adolescents and young adults often rises, in addition to an increased incidence in other age groups (14). This pattern is believed to be caused at least in part by the introduction of a new strain to which the population has little immunity. The increase in adolescents and young adults is similar to the pattern we observed in Maryland, although no associated epidemic occurred. Analogous to the epidemic setting, we hypothesized that the increase in persons ages 15–24 years was due to the introduction of a serogroup C clone. We expected that the increase was caused in large part by this new clone because adolescents and young adults typically otherwise have a low risk for meningococcal infection. This situation contrasts to that of younger children and older adults, who, in general, are more susceptible to meningococcal infection and therefore might be expected to be infected with a broader range of strains (2,15). A similar pattern was recently observed in Oregon, although the increase in that case was caused by a serogroup B clone (14). Although our study had not begun early enough to determine whether clonal group 3 serogroup C strains were recently introduced into Maryland, the finding that serogroup C infection in persons ages 15–24 years was caused by strains that were more similar by PFGE to each other than serogroup C infection in other age groups generally supports our hypothesis. The emergence of a new PFGE-defined clone in adolescents in 1999 was somewhat surprising since the meningococcal incidence was decreasing in this age group during that time. The shift from one ST-23 complex serogroup Y clonal group to another during the 1990s may also have been associated with changes in population immunity that occur over time because of the circulation of N. meningitidis in the community. However, since we did not study whether the two clonal groups differed in cell surface immunogens, this hypothesis is speculative. MLST has recently been validated as an alternative method to MEE. We found that PFGE discriminated among strains with the same ET. For example, MLST could not discriminate between the two serogroup C PFGE-defined clones in the 1997 and 1999 outbreaks. This result was similar to the findings of a recent study in which meningococcal isolates with the same ET were found to have distinct PFGE patterns (7). Taken together, these data indicate that PFGE and MLST are complementary methods for studies of the molecular epidemiology of N. meningitidis infection (3,7). In summary, epidemiologic trends in invasive meningococcal disease in Maryland from 1992 to 1999 were associated with specific PFGE-based genotypes of serogroup C and Y strains. Additional studies will be needed to determine whether future changes in meningococcal incidence are associated with variations in the strains causing invasive disease. Acknowledgments
References
|
||||||||||||||||||||||||||||||||||||||||||
|
|
||||||||||||
|
||||||||||||
|
|
|
EID Home | Top of Page | Ahead-of-Print | Past Issues | Suggested Citation | EID Search | Contact Us | Accessibility | Privacy Policy Notice | CDC Home | CDC Search | Health Topics A-Z |
||
|
This page posted February
19, 2004 |
||
|
Emerging
Infectious Diseases Journal |
||