The World Bids Farewell to the Multifiber Arrangement
Stephen
MacDonald
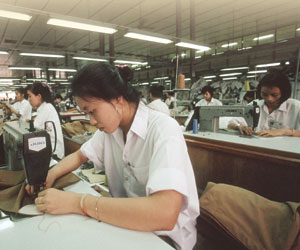
Steven Raymer, Getty Images
Clothing is one of life’s
necessities, so a new trade policy that lowers clothing
prices affects us all. Such a change took place
at the beginning of 2005, as the U.S., Canada, and
the European Union (EU) discontinued most of their
limits on imports of yarn, fabric, and clothing
from developing countries. Under the Multifiber
Arrangement (MFA), trade in textiles—that
is, yarn and fabric—and clothing was managed
through quotas. January 1, 2005, marked the end
of a 10-year phaseout of the MFA quotas under the
aegis of the World Trade Organization. This article
examines the origins and spread of quotas under
the MFA and the impacts of their subsequent elimination.
What Was the MFA?
The MFA was a multilateral agreement
signed in 1974, but its roots stretch back to the
1930s. At that time, during a period of global economic
distress, Japan emerged as the largest exporter
of cotton textiles, and the U.S. and Europe moved
to limit imports from Japan to preserve their domestic
markets for their own textile industries. These
restraints never really went away. By the 1960s,
they had been extended to Hong Kong, Pakistan, and
India. As the restraints on textile trade became
globalized, multilateral negotiations ensued, leading
to a series of agreements. Initially, the agreements
covered only cotton, but they eventually expanded
into “multifiber” arrangements covering
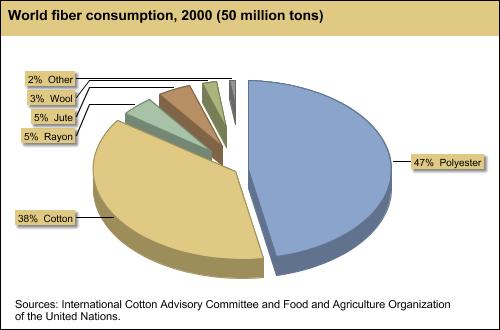
textiles and clothing made from all fibers: cotton
accounts for about 38 percent of world fiber consumption.
At the heart of the MFA were a
set of bilateral agreements between developed-country
importers, such as the U.S., and developing-country
exporters, such as China and Bangladesh. The MFA
did not apply to trade among the developed countries.
The number of U.S. bilateral export restraint agreements
grew from a single agreement with Japan in 1962
to agreements with 30 countries by 1972 and with
40 by 1994. Each agreement governed trade in as
many as 105 categories of textiles and clothing,
with new categories added to the agreements as the
need to avoid “market disruption” arose.
In one sense, the impact of the MFA was quite simple.
By limiting imports, the U.S. and the EU raised
their domestic prices of clothing. Domestic production
rose, and domestic consumption fell. Outside of
these two markets, however, the effects were more
complex, as the restraints on one set of countries
created opportunities for others, driving changes
in world clothing markets. Limits on exports by
Japan and Hong Kong increased export opportunities
for Taiwan and South Korea. Restraints then imposed
on Taiwan and South Korea increased opportunities
for Thailand and Indonesia. In this way, the MFA
grew, but investment in clothing production also
spread. Entrepreneurs from countries limited by
the MFA shifted capital and expertise to countries
that otherwise lacked the ability to export significant
amounts of clothing. So, for some countries, the
attempt to limit global exports actually spurred
an increase in exports.
Another twist to the MFA’s impact came from
the North American Free Trade Agreement (NAFTA)
and from similar regional trade arrangements between
the EU and its neighboring countries. Typically,
these agreements relax or remove the quota restrictions
on neighboring exporters. Examples include Mexico
in the case of the United States, and Turkey and
other Mediterranean countries for the EU. In this
way, Mexico and Turkey benefited indirectly from
the MFA’s restraints on their competitors.
Case Study: U.S. Imports of Cotton
Trousers
To understand the global impact
of the MFA, it is useful to take a closer look at
U.S. imports of one particular product—cotton
trousers. The distribution of U.S. quotas and trade
for cotton trousers illustrates the evolution of
the MFA and global clothing trade during the 30
years that the MFA governed world trade and helps
us understand the changes in store for global trade
now that the MFA is behind us.
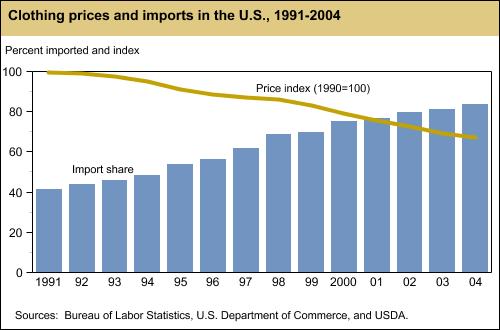
About 80 percent of the 180 million dozen cotton
trousers purchased annually in the U.S. are imported,
approximately the same as for most U.S. clothing
and for clothing in most developed countries. In
1974, in contrast, imports accounted for 10 percent
of U.S. consumption. The geography of that trade
has also changed dramatically over the last three
decades. Once, Japan was a major clothing exporter
to the U.S, but Japan now imports most of its clothing.
Other lower income countries have taken its place
as suppliers of U.S. trousers. The fundamental reason
for this shift is that labor comprises a much larger
share of the cost of clothing than it does for most
manufactured products. Wages in China are one-tenth
those in the U.S, and wages for textiles and clothing
workers in India and Bangladesh are half those in
China. Wages are only one factor in determining
competitiveness, and the superior infrastructure
and education of the developed countries were traditionally
able to offset lower wages. But this advantage has
tended to erode over time as communication and transportation
costs have fallen, and developing economies have
become more integrated into the world economy.
The global economy has proven to be more dynamic
than the political economy of protectionism, and
the rigidity of the system of managed trade has
had some unexpected consequences. In 2004, for example,
Taiwan and India, two very different countries,
had nearly identical quotas for cotton trouser exports
to the United States—around 1 million dozen
pairs each. While not as advanced as Japan’s,
Taiwan’s economy long ago graduated from a
focus on textiles to more sophisticated, higher
value products. Competing for resources with higher
paying industries in Taiwan, Taiwan’s trouser
producers were no longer able to export as many
trousers as permitted under its quota. Taiwan’s
exports of cotton trousers filled 70 percent of
its allocated quota in 2004, while India filled
96 percent of its quota.
| U.S. cotton trouser
imports1 |
| Source
|
MFA quota
2004 |
Quota
fill rate |
Imports
2004 |
Import
growth 20052 |
| |
Million
dozen pair |
Percent |
Million
dozen pair |
Percent |
| World |
NA |
NA |
149.3
|
15 |
| Mexico |
NA |
NA |
31.4
|
-10 |
| Hong Kong |
7.0 |
88 |
6.1 |
-3 |
| Guatemala |
3.3 |
80 |
2.7 |
-17 |
| Bangladesh |
4.5 |
85 |
3.8 |
99 |
| China |
2.4 |
84 |
2.0 |
1,094 |
| India |
1.5 |
96 |
1.4 |
100 |
| Taiwan |
1.5 |
70 |
1.1 |
-2 |
| Kenya |
NA |
NA |
3.1 |
0 |
NA=Not available.
1MFA category 347/348.
22005 figures based on 9 months
of data.
Sources: Office of Textiles and Apparel, U.S.
Department of Commerce and
U.S. Customs and Border Protection. |
As a result, in 2004, the MFA was indirectly protecting
the industry of a former U.S. competitor—Taiwan—while
India’s quota, which reflected India’s
competitive stature of at least a decade before,
was frozen in time. As the MFA coalesced during
the 1970s and 1980s, India’s economic policies
encouraged a textile industry geared to providing
employment to village handweavers and providing
low-cost cotton cloth to its own population. India’s
exports were generally anemic during that period,
and its MFA quotas often went unfilled. Since the
beginning of the 1990s, however, India’s economy
has been dramatically reoriented toward exports,
and India’s export capacity has surged. As
a result, India’s exports of other textile
products have grown, and it is well positioned to
take advantage of the MFA’s phaseout. However,
before the end of MFA, its access to the U.S. market
for numerous products was encumbered by the outcome
of negotiations concluded many years before.
China’s 2004 quota for cotton trouser exports
to the U.S was about double India’s—2
million dozen pairs—reflecting the rapid growth
of China’s industry at the time the MFA restrictions
on this product crystallized. But China accounted
for only 1 percent of U.S. cotton trouser imports.
China accounted for about 25 percent of world textile
and clothing exports in 2004, and with the end of
the MFA, this is expected to grow. But, when China
began reorienting its economy in 1979, its textile
industry, like India’s, was domestically oriented.
Exports began rising sharply. By September 1980,
China and the U.S had negotiated their first bilateral
textile agreement. China’s cotton trouser
quota has remained essentially fixed since the beginning
of the 1980s, while China’s textile industry
has grown to be the world’s largest by moving
into other products and other markets.
Another explanation for China’s low share
in U.S. cotton trouser imports is the role that
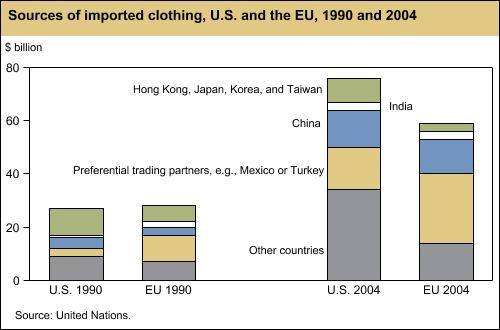
preferential trade agreements have played in U.S.
textile trade. Although much of U.S. trade in cotton
trousers was shaped by the MFA, over half of the
149 million dozen cotton trousers imported by the
U.S. in 2004 were imported outside the MFA. Most
of those imports came from neighboring countries,
the result of preferential access granted through
NAFTA, the Caribbean Basin Initiative (CBI), and
the Andean Trade Preference Act. Mexico’s
31 million dozen pairs of exports were exempt from
a specific quota. While Guatemala exported 2.7 million
dozen pairs under quota in 2004, its exports outside
the quota system were even larger thanks to its
preferential access.
Like NAFTA and the CBI, the African Growth and Opportunity
Act (AGOA) of 2000 granted preferential access as
a form of economic aid to low-income African countries.
This agreement allowed Kenya, Lesotho, and more
than 30 other African countries to export cotton
trousers and other products to the U.S. outside
the MFA quota system. The passage of AGOA attracted
investment and expertise—mostly from Asian
firms—to these countries’ textile and
clothing sectors. Kenya’s cotton trouser exports
to the U.S rose from 287,000 dozen pairs in 1998
to 3.1 million in 2004, and Kenya garnered a 2-percent
share of U.S. imports, twice that of China. In this
way, the MFA indirectly encouraged clothing production
in new corners of the world. In the 1970s, Hong
Kong firms moved resources to Mauritius as quota
restraints became binding. In the 1980s, South Korean
entrepreneurs began investing in Bangladesh. The
end of the quota system has removed some of the
incentives to invest in a number of these countries,
and their economies are having to adjust to a lower
level of clothing exports and employment.
Short-Term Outlook for the Post-MFA
World
Most economists analyzing the
MFA agree that free trade in textiles and clothing
will mean significantly larger exports by China,
India, and Pakistan (Pakistan filled 100 percent
of its cotton trousers quota in 2004). Higher income
exporters like Taiwan, Korea, and Hong Kong can
expect to export less. The same is true of countries
with preferential access to the U.S. and EU markets.
U.S. imports of cotton trousers in 2005 bear out
these expectations. During the first 9 months of
2005, U.S. imports rose 15 percent, but imports
from Mexico, Guatemala, Sub-Saharan Africa, Hong
Kong, and Taiwan fell. On the other hand, imports
from India rose 100 percent, and imports from China
rose 1,094 percent.
Not all of China’s clothing exports are expected
to increase by 1,000 percent. Analysts expect gains
of 20-100 percent in China’s total clothing
exports. Based on the cost of purchasing an export
license from China to the United States, economists
estimate that the impact of the MFA on China’s
trade was equivalent to a 20- to 30-percent import
tariff. Similar estimates for other exporters tend
to be lower, and the changes in 2005 U.S. cotton
trouser imports confirm this pattern. While China’s
wages may exceed those in some other countries,
its superior infrastructure helps ensure more timely
delivery and higher productivity.
China’s export gains will be constrained in
the short term by the “safeguard” mechanism
permitted under its 2001 WTO accession agreement.
WTO members have the right under certain circumstances
to limit growth in their textile imports from China
through 2008. To limit the disruption of ad hoc
safeguard applications, the U.S. and the EU reached
bilateral agreements with China in 2005. These agreements
govern textile trade very much the way the MFA did,
albeit for a smaller number of products and with
a higher level of imports. Furthermore, none of
the other WTO exporters formerly constrained by
MFA quotas faces any such restraint (see “China
Leads World Textile Trade, But For How Long?”).
For the U.S. and EU, the removal of the 20-percent
or so implicit tax the MFA imposed on much of their
imported clothing has led to increases in clothing
imports by both regions. Domestic clothing prices
can be expected to fall 5-10 percent, once production
and consumption adjust to a new equilibrium. As
clothing imports rise, the mix of exporters and
products will change. The U.S. and EU can also expect
to see increased availability of lower quality clothing.
The experience of voluntary export restraints in
automobiles, footwear, and steel during the 1980s
attests to the “quality-upgrading” exporters
undertake in the face of quotas. Quotas create opportunities
for unusually high profits, and the resulting welfare-reducing
inefficiencies include a shift to more expensive
lines of products.
China
Leads World Textile Trade, But For How Long?
Today, many of the questions about the future
of international textile trade, policy,
and consumption revolve around China. The
expansion of China’s textile production
and exports has seemed relentless. The textile
industry was among the first to benefit
from China’s opening to the rest of
the world at the end of the 1970s. China’s
clothing producers are well positioned to
coordinate with the design and management
capabilities of Hong Kong. They have ready
access to high-quality fabric produced in
countries like Japan, as well as to their
own burgeoning domestic production.
China’s role in global textile trade
may be constrained in the short term by
the special safeguard provisions of its
2001 accession to the WTO. These safeguards,
which will remain applicable through 2008,
can limit China’s export growth in
specific products to a 7.5-percent annual
rate. The United States applied these safeguards
to a few products in 2003. Turkey and Argentina
implemented broader sets of safeguards immediately
after the end of the MFA, and Brazil has
announced its intention to restrict textile
imports from China. In May 2005, the United
States applied safeguard provisions to cotton
trousers, cotton shirts, and underwear.
In 2004, the EU took steps to raise the
tariffs it applies to clothing imports from
China, and in June 2005, announced restrictions
for 10 products imported from China. The
United States and the EU each subsequently
negotiated new bilateral textile trade agreements
with China in 2005, which could limit China’s
exports to these markets through 2008.
China also has longer term pressures. During
the last few years, reports of rising wages
in China have emerged, particularly for
the Pearl River Delta near Hong Kong. Electrical
power shortages are also reportedly more
frequent, suggesting rising costs in more
than one respect. While China is unquestionably
the global leader today, leadership in global
textiles has shifted from one country to
another over the centuries. Before the Industrial
Revolution, India’s cotton textiles
dominated world trade. Later, England and
then Japan and Hong Kong rose to prominence.
In the long run, the only certainty is change,
and China will have to face this issue as
well.
|
Many Sources of Uncertainty in
the Long Term
The elimination of the MFA will
lead to longer term structural changes in the global
textile industry, and these are harder to predict.
The pursuit of profits under the MFA introduced
inefficiencies in clothing production, which may
require time to eliminate. Firms in many developing
countries were structured to acquire quota and then
maximize the profits from this quota rather than
simply to compete in the marketplace. Similarly,
U.S. and EU importers pursued the “excess
profits” inherent in a quota system and, by
some measures, succeeded in capturing a significant
share. These factors are difficult to measure and
add uncertainty to the outlook for the post-MFA
world.
Another source of uncertainty is that the elimination
of the MFA did not occur in isolation. Other forces,
such as the depreciation of the U.S. dollar and
technological change, may also affect textile and
clothing trade. In the United States, a weakening
dollar would tend to put upward pressure on clothing
prices, perhaps offsetting the downward pressure
exerted by the removal of the quotas. Moreover,
clothing prices around the world have fallen in
recent years as globalization and technical change
increased trade and reduced distribution costs.
The exchange of point-of-sale information (“electronic
data interchange”) between retailers and manufacturers
has reduced inventory costs substantially, and the
rise of discount retailing has been a global phenomenon.
With so many other changes taking place in the global
economy, it is hard to predict exactly the most
important shifts consumers will face in the immediate
aftermath of the MFA.
Furthermore, the MFA was far from being the only
trade policy instrument relevant to global textile
trade. Tariffs on textiles and clothing are typically
several times higher than the 4-percent global average
for manufactured products. Anti-dumping cases have
been pursued around the world with increasing frequency.
Many countries apply nontariff barriers to textile
and clothing imports. Finally, the high labor component
of clothing production helps make it a sensitive
industry in the eyes of many governments.

The
Forces Shaping World Cotton Consumption After the
Multifiber Arrangement, by Stephen MacDonald
and Thomas Vollrath, CWS-05C-01, April 2005.
Cotton
and Wool Outlook
See also Bilateral
fiber and Textile Trade database.
Growth
Prospects for India's Cotton and Textile Industries,
by Maurice Landes, Stephen MacDonald, Santosh K.
Singh, and Thomas Vollrath, CWS-05D-01, June 2005.
ERS Briefing Rooms on Cotton
and China.
|