 |
|
|
|
|
|
|
|
|
|
|
|
|
|
|
|
|
||||
| ||||||||||
|
|
|
|
Vaccination Coverage Levels Among Alaska Native Children Aged 19--35 Months --- National Immunization Survey, United States, 2000--2001In 2000, a total of 118,846 persons indicated that their race/ethnicity was Alaska Native (AN), either alone or in combination with one or more other racial/ethnic groups (1). AN groups comprise 19% of the population of Alaska (2) and 0.4% of the total U.S. population. The AN grouping includes Eskimos, Aleuts, and Alaska Indians (members of the Alaska Athabaskan, Tlingit, Haida, or other AN tribes). Eskimo represented the largest AN tribal grouping, followed by Tlingit/Haida, Alaska Athabascan, and Aleut (1). Vaccination coverage levels among AN children have not been reported previously. This report presents data from the National Immunization Survey (NIS) for 2000--2001, which indicate that vaccination coverage levels among AN children aged 19--35 months exceeded the national health objective for 2010 (objective no. 14-22) for the majority of vaccines. This achievement indicates the effectiveness of using multiple strategies to increase vaccination coverage. Similar efforts might increase vaccination coverage in other rural regions with American Indian (AI)/AN populations. NIS is an ongoing, random-digit--dialed telephone survey that provides national and state-level estimates of vaccination coverage among children aged 19--35 months on the basis of data for the most recent 12 months for each of the 50 states and 28 selected urban areas. Reports on NIS methodology have been published previously (3). The vaccination data in this report were verified by the children's vaccination providers. Because the number of AN children included each year in NIS is small, data were combined from 2 years (2000--2001) for which a child's racial/ethnic group identity could be determined to be AN. For this study, ANs included all children whose racial/ethnic group identities were recorded as AN either alone or in combination with another racial/ethnic population. Because 90% of AN children included in NIS resided in Alaska, vaccination coverage estimates and corresponding 95% confidence intervals were calculated among AN and non-AN children in Alaska and in all states combined, and the demographic characteristics of these children in Alaska and in all states combined were assessed. Nationally and in Alaska, vaccination coverage levels among AN children exceeded the national health objective for 2010 of 90% coverage for >3 doses of any diphtheria and tetanus toxoids and pertussis (DTP) vaccine, >3 doses of any poliovirus vaccine, >1 dose of measles-mumps-rubella vaccine, >3 doses of Haemophilus influenzae type b (Hib) vaccine, and >3 doses of hepatitis B vaccine (Table 1). Varicella vaccine coverage was low in Alaska and in all states combined; in Alaska, varicella coverage was similar among AN and non-AN children (Table 1). AN children were more likely than non-AN children to be from households below the poverty level and with four or more children (Table 2). AN children also had a higher proportion of mothers who had less than a high school education and who never were married. They were also more likely to obtain their vaccinations in public-sector facilities (Table 2). Reported by: L Wood, MPA, Alaska Dept of Health and Social Svcs, Anchorage. T Santibanez, PhD, L Barker, PhD, National Immunization Program; R Singleton, MD, Alaska Native Tribal Health Consortium and Arctic Investigations Program, National Center for Infectious Diseases, CDC. Editorial Note:This report indicates that the level of vaccination coverage for AN children aged 19--35 months exceeds the national goal for 2010 of 90% for all vaccines except varicella and the fourth dose of DTP. These high coverage levels have been achieved despite the presence of factors traditionally associated with low vaccination coverage (e.g., household income below poverty level, large number of children in household, low level of maternal education, and mother being unmarried). This success might be attributed to at least six factors. First, Alaska is a universal vaccine coverage state; all children, including ANs, receive vaccines through a partnership among state public health authorities, tribal health programs, and Alaska physicians. AN children receive vaccines without charge through support from the federal Vaccines for Children program and are provided comprehensive health-care services without charge, funded by the federal government through tribally administered health facilities (4). During 2000--2001, AN tribes and tribal organizations in Alaska operated seven hospitals, 23 ambulatory health centers, and 160 village clinics (5). Second, vaccination delivery in rural Alaska is a collaborative effort between state or tribal public health nurses and tribal health facilities (6). Certified community health aides are located in village clinics, and state and corporation public health nurses visit villages to deliver vaccines. Third, high rates of Hib and pneumococcal disease among ANs in the prevaccination era have made vaccination delivery a high priority among tribal corporations, state public health agencies, and health-care providers serving AN populations (7,8). Fourth, each major tribal health corporation and/or regional state public health nursing center conducts vaccination tracking and recall, which has been proven to be effective for increasing coverage (9). Fifth, the Alaska Native Tribal Health Consortium Immunization Program monitors coverage regularly, reports to the Indian Health Service, and implements interventions to improve coverage. Finally, the majority of tribal facilities have access to computerized immunization registries that enable automated point-of-service data accessibility, tracking and recall, and practice- and geographic-based vaccination coverage assessment and feedback. Challenges exist to achieving and maintaining high vaccination coverage. Despite being the largest state, Alaska ranks 48th among the 50 U.S. states in population. A substantial number of state residents live in areas not accessible by roads. Nearly two thirds (65%) of ANs live outside the state's two largest cities (Anchorage and Fairbanks), including those who live in remote villages accessible only by air, boat, or snow machine. Alaska was one of the last states to initiate universal varicella vaccination because of the difficulty in ensuring the cold chain in rural areas. The findings in this study are subject to at least three limitations. First, NIS is a telephone survey, and a disproportionate number of ANs do not have telephone service. However, NIS is adjusted to account for households without telephones, which reduces this bias for national coverage estimates but might not be as accurate for estimates in small populations that have low telephone coverage (10). Second, because NIS relies on provider-verified vaccination histories, incomplete records and reporting could result in underestimates of coverage. The estimation procedure assumed that vaccination coverage levels among children whose health-care providers did not respond were similar to those among children whose providers did respond (3). Finally, although NIS national coverage estimates are precise, state estimates are less precise and should be interpreted with caution. Vaccination coverage among AN children is higher than national coverage levels for the majority of vaccines. This finding is in contrast to overall coverage estimates among all American Indians (AIs)/ANs, which usually are slightly below national coverage levels. This achievement, despite the presence of barriers to vaccination, demonstrates the commitment of AN communities, tribal corporations, and state public health authorities to address health concerns and exemplifies the effectiveness of using multiple strategies (e.g., reducing financial and access barriers; making vaccination a priority; and using collaborative efforts, tracking and recall, assessment, and registries). This successful model in Alaska suggests that similar efforts might be equally effective at increasing vaccination coverage in other rural regions with AI/AN populations. References
Table 1 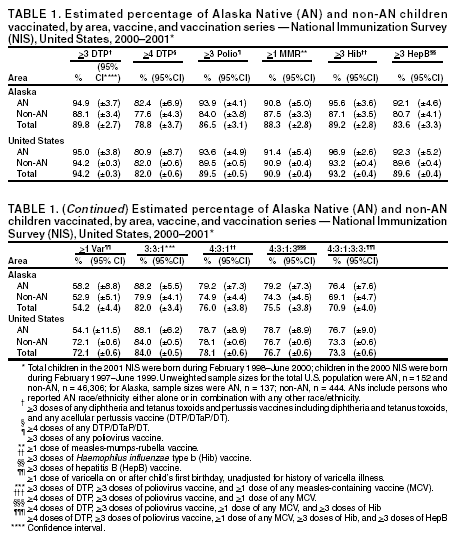 Return to top. Table 2 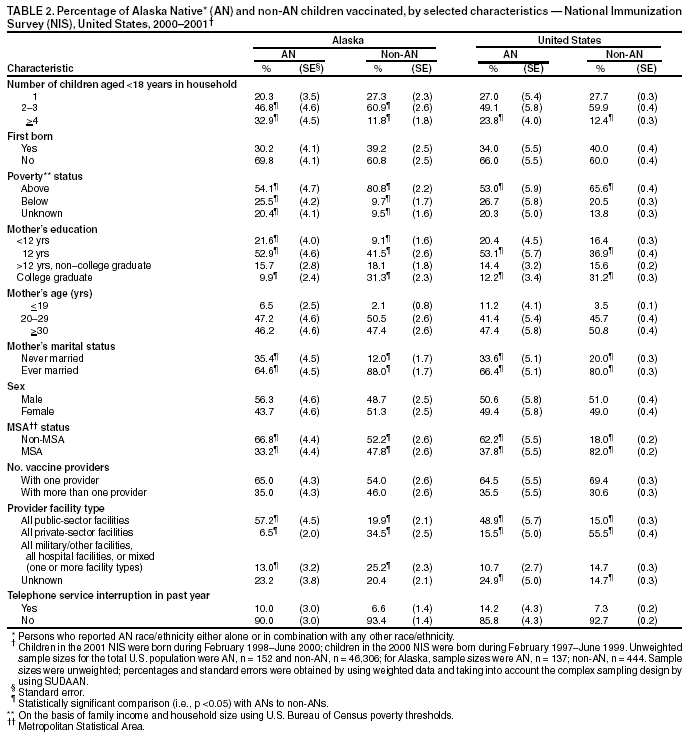 Return to top.
Disclaimer All MMWR HTML versions of articles are electronic conversions from ASCII text into HTML. This conversion may have resulted in character translation or format errors in the HTML version. Users should not rely on this HTML document, but are referred to the electronic PDF version and/or the original MMWR paper copy for the official text, figures, and tables. An original paper copy of this issue can be obtained from the Superintendent of Documents, U.S. Government Printing Office (GPO), Washington, DC 20402-9371; telephone: (202) 512-1800. Contact GPO for current prices. **Questions or messages regarding errors in formatting should be addressed to mmwrq@cdc.gov.Page converted: 7/31/2003 |
|||||||||
This page last reviewed 7/31/2003
|