
Yellowstone Lake Earthquake Swarm Summary as of 8 January 2009
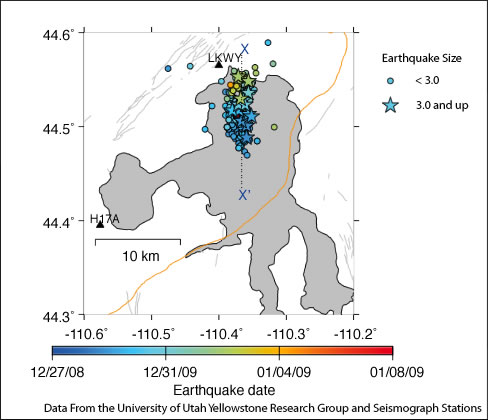
Image 1. Yellowstone Lake showing location and times of the recent
earthquakes from Dec. 27, 2008 (blue) to Jan. 8, 2009 (red). The
M 3.0 and greater earthquakes are shown as stars, the smaller
earthquakes are shown as circles. During the swarm, the earthquake
locations appear to have moved north. For more information on the
depths of the earthquakes, see the cross section from X to X' below.
Click on the image for a full-size version.
Seismic activity at Yellowstone Lake in Yellowstone National Park increased in late December 2008. As of January 8, 2009, the seismic activity has markedly decreased (Listen to a podcast with YVO's Scientist-in-Charge about the recent swarm). It is possible that the swarm has ended, although a return of activity may occur as previous Yellowstone swarms of this size have lasted for tens of days to many weeks. Swarms are common at Yellowstone. The last notable swarm occurred in 2004, please see our 2004 article, Yellowstone Earthquake Swarms for more background on earthquakes and swarms at Yellowstone.
Seismologists continue to review the earthquakes
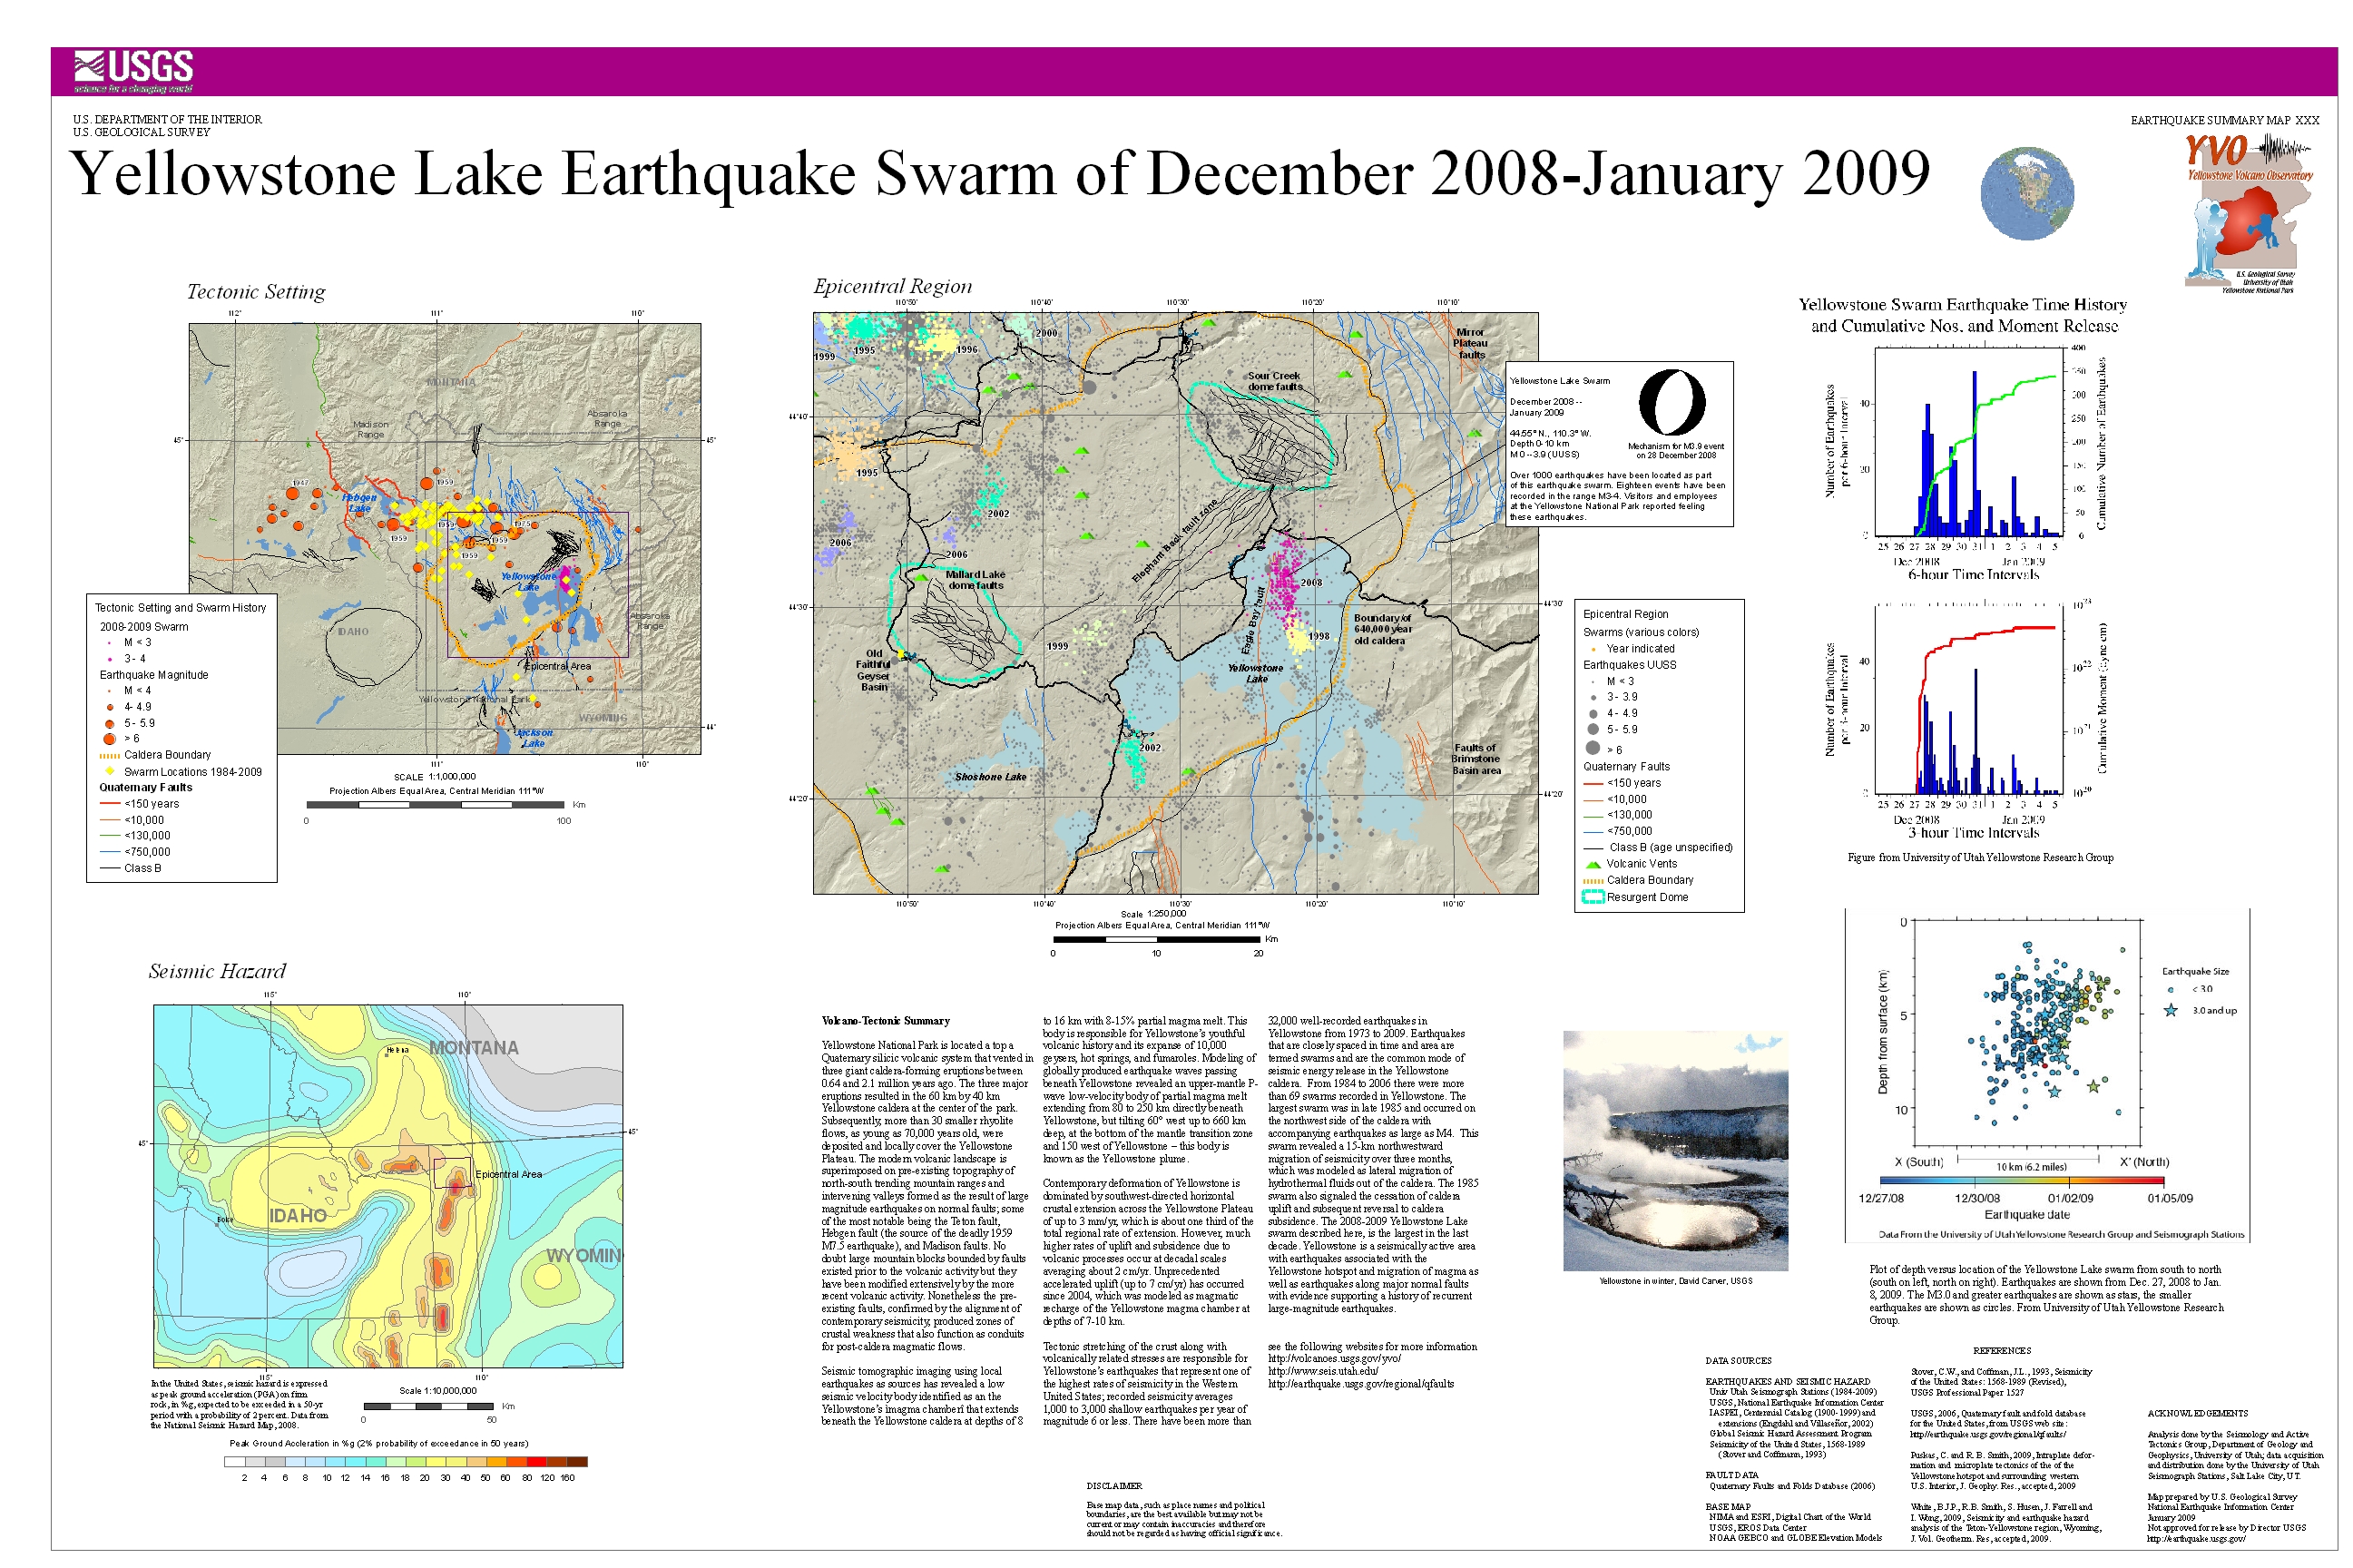
About 900 earthquakes occurred between Dec. 26, 2008 and Jan. 8, 2009 in the Yellowstone Lake area. Five hundred of the earthquakes (including all greater than magnitude 2.0) have been reviewed by seismologists. There were 111 earthquakes with magnitudes greater than 2.0 (> M2.0)and 18 earthquakes > M3.0. About 400 smaller earthquakes have yet to be reviewed. [A new Frequently Asked Question about earthquake analysis will be posted here soon]. The largest earthquake during the swarm was a magnitude 3.9 on Sunday, December 28, 2008. One of the analyses seismologists use to talk about earthquakes and swarms is the cumulative seismic moment, which is a measure of the earthquake energy. The cumulative moment (the energy from all the analyzed earthquakes in the swarm) for the Yellowstone Lake Swarm is equal to the energy of a single magnitude 4.5 earthquake (see Image 3).
Depths for shallow earthquake hypocenters (the point within the earth where an earthquake rupture starts) are difficult to determine accurately unless the seismic stations are spaced much more closely than those in the Yellowstone Seismic Network. The best located earthquakes have hypocenters (depths) of 3 to 10 km (1.8 to 6.0 miles). From Dec. 26 through Jan 2, the hypocenters appear to have migrated northwards, starting southeast of near Stevenson Island, with many of the latest events occurring near Fishing Bridge.

Image 2. The depth versus location of the Yellowstone Lake
earthquake swarm from X to X' on the Yellowstone Lake map.
Earthquakes are shown from Dec. 27, 2008 (blue) to
Jan. 8, 2009 (red). The M 3.0 and greater earthquakes are shown as
stars, the smaller earthquakes are shown as circles. Click on the
image for a full-size version.
Swarms are normal at Yellowstone
The recent swarm is well above typical activity at Yellowstone. Nevertheless it is not unprecedented during the last 40 years of monitoring. Earthquake swarms within the Yellowstone caldera are typical, with magnitudes occasionally ranging above 4.0. The 1985 swarm on the northwest rim of the caldera lasted for three months, with earthquakes up to M4.9 and over 3000 total events recorded.
The magnitudes of earthquakes in this swarm range from zero to 3.9. Earthquakes with magnitudes less than 3.4 are generally not felt by people unless they are very shallow and you are standing very close to the epicenter (point on the earth's surface above the hypocenter). For perspective, earthquakes of magnitude 3.4 to 4.5 are often felt and there were multiple reports of felt earthquakes during this swarm. A magnitude 5 or greater is generally required to produce damage to buildings or other structures.
Image 3. Number of reviewed Yellowstone Lake earthquakes in six-hour and three-hour
intervals from 12/27/08 to 01/06/09. The green line on the left figure gives the cumulative
number of earthquakes; the steep slopes correspond to increase in earthquake number. The
red line in the figure on the right gives the cumulative moment, or energy; its sharp
increase in the first few days is due to a greater number of large earthquakes with their
greater energy release. The total cumulative moment is equivalent in energy to about one
M 4.5 earthquake. Click on the image for a full-size version.
New equipment allowed us to monitor the swarm
Improved volcano and seismic monitoring at Yellowstone gives us a greater ability to locate earthquakes, understand their source process and identify anomalous sources of seismic activity. New equipment including precise measurements of ground motion by GPS receivers and borehole strainmeters provided by the National Science Foundation's EarthScope and Continental Dynamics Program have been used extensively during the last week of intense earthquake activity. Ground motions accompanying the swarm, from the GPS instruments will take two or more weeks to fully process. It is worth noting that in 2004 the Yellowstone caldera began a period of accelerated uplift measured by GPS instruments that was as large as 7 cm/yr (2.7 inches/yr), three times as fast as recorded in the recorded history but has now reduced to about a maximum rate of 4 cm/yr. Scientists have modeled this deformation as due to magmatic recharge of the Yellowstone magma chamber at a depth of ~10 km (6 miles). The area of the swarm is on the eastern side of the uplift area. For more information on the uplift, please see our article Recent ups and downs of the Yellowstone Caldera.
There are several causes for earthquakes
Earthquakes at Yellowstone are caused by a combination of geological factors including: 1) regional stress associated with normal faults (those where the valleys go down relative to the mountains) such as the nearby Teton and Hebgen Lake faults, 2) magmatic movements at depth (>7 kms or 4 miles), and 3) hydrothermal fluid activity caused as the groundwater system is heated to boiling by magmatic heat.
At this time, no one has noted any anomalous changes in surface discharges (hot springs, gas output, etc.).We continue to monitor Yellowstone Volcano
YVO staff from the USGS, University of Utah and Yellowstone National Park continue to carefully review all data streams that are recorded in real-time. At this time, there is no reason to believe that magma has risen to a shallow level within the crust or that a volcanic eruption is likely. The USGS Volcano Alert Level and Aviation Color Code for Yellowstone remain at Normal and Green.
Yellowstone National Park is evaluating infrastructure near the north end of Yellowstone Lake to assess if any damage has occurred to facilities.
Winter visitor activities and staff operations have not been impacted and continue as normal.
The Yellowstone Volcano Observatory (YVO) is a partnership of the U.S. Geological Survey (USGS), Yellowstone National Park, and University of Utah to strengthen the long-term monitoring of volcanic and earthquake unrest in the Yellowstone National Park region. Yellowstone is the site of the largest and most diverse collection of natural thermal features in the world and the first National Park. YVO is one of the five USGS Volcano Observatories that monitor volcanoes within the United States for science and public safety.
Other items of interest
- Added Jan. 14, 2009: USGS Yellowstone Lake Earthquake Swarm December 2008 – January 2009 Summary Poster (pdf format, 6.3 MB - Click here for a preview)
- More Yellowstone Lake Earthquake Swarm Images
- Jan 7, 2009: Podcast with YVO's Scientist-in-Charge, Jake Lowenstern, about the recent swarm
- Oct 2004 Web Article: Earthquake Swarms at Yellowstone
- Jan 2004 Web Article: Frequently asked questions about findings at Yellowstone Lake
- Nov. 2007 Web Article: Recent ups and downs of the Yellowstone Caldera
- March 2007: Preliminary Assessment of Volcanic and Hydrothermal Hazards in Yellowstone National Park and Vicinity.
- Nov. 2006: Volcano and Earthquake Monitoring Plan for the Yellowstone Volcano Observatory, 2006-2015
- Monitoring super-volcanoes: geophysical and geochemical signals at Yellowstone and other large caldera systems
- 2006 Web Article: Satellite Technologies Detect Uplift in the Yellowstone Caldera
- NVEWS report May 2005: An Assessment of Volcanic Threat and Monitoring Capabilities in the United States: Framework for a National Volcano Early Warning System
- 2005 Article: Truth, fiction and everything in between at Yellowstone
- 2005 Fact Sheet:Steam Explosions, Earthquakes, and Volcanic Eruptions — What's in Yellowstone's Future?
- 2004 Fact Sheet: Tracking Changes in Yellowstone's Restless Volcanic System
- 2003 Web Article: Notable Changes in Thermal Activity at Norris Geyser Basin Provide Opportunity to Study Hydrothermal System
