
|
||||||
|
|
||||||
|
|
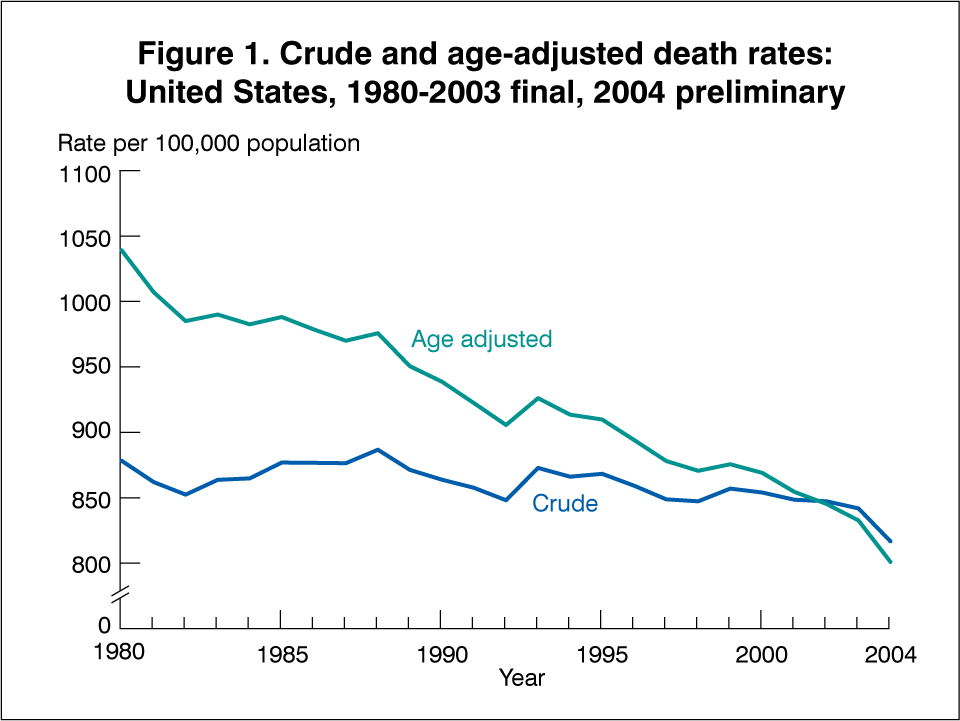
May 2006 Deaths: Preliminary Data for 2004by Arialdi M. Miniño, M.P.H.; Melonie Heron, Ph.D.; and Betty L. Smith, B.S. Ed., Division of Vital Statistics This report from the Centers for Disease Control and Prevention’s National Center for Health Statistics (NCHS) provides selected key findings from 2004 preliminary mortality data for the United States. The findings come from a substantial portion of the records of deaths that occurred in calendar year 2004 and were received and processed by NCHS as of September 12, 2005. Mortality records are based on information reported on death certificates as completed by funeral directors, attending physicians, medical examiners, and coroners. A report that includes a more complete analysis of the preliminary data is forthcoming (1). Key findings from this report, as illustrated in Tables 1-3 and Figures 1 and 2, follow. Highlights from Preliminary Mortality Data, 2004
Trends
Technical Notes
Nature and sources of data For 2004, individual records of infant deaths (deaths under 1 year of age) and deaths of persons aged 1 year and over are weighted (when necessary) to independent counts of deaths occurring in each state. These state-specific counts serve as control totals and are the basis for the record weights in the preliminary file. For this report, two separate files are processed: the medical file, or cause of death file, containing records that include demographic and medical information that is used to generate tables showing cause of death; and the demographic file that includes records from the medical file, as well as additional records containing demographic information only and is used to generate tables showing mortality by demographic characteristics only. A state-specific weight is computed for each file by dividing the state control total by the number of records in the preliminary sample. Because there are two separate files, with two separate sets of weights, slight inconsistencies might occur between the demographic and medical tables in this report. For certain causes of death such as unintentional injuries, homicides, suicides, and respiratory diseases, preliminary and final data differ because of the truncated nature of the preliminary file. For selected variables in the mortality file, unknown or not stated values are imputed. Detailed information on reporting completeness and imputation procedures can be found in Technical Appendix, Vital Statistics of the United States: Mortality, 1999 (2).
2003 revision of the U.S. Standard Certificate of Death, multiple
race data, and Hispanic origin The 2003 revision of the U.S. Standard Certificate of Death allows the reporting of more than one race (multiple races). This change was implemented to reflect the increasing diversity of the population of the United States and to be consistent with the decennial census (3). The new standards of the Office of Management and Budget mandate the collection of more than one race for federal data (6). In addition to states reporting multiple race information via their revised death certificates, multiple race was also reported on the unrevised certificates of Hawaii, Maine, Minnesota, and Wisconsin. Refer to the “Technical Notes” of the forthcoming full report for details (1). In order to provide uniformity and comparability of the data during the transition period (before all or most of the data are available in the new multiple-race format), it was necessary to ‘‘bridge’’ the responses of those for whom more than one race was reported (multiple race) to one, single race. The bridging procedure of mortality data is similar to the procedure used to bridge multiracial population estimates provided by the U.S. Census Bureau. Multiracial decedents are imputed to a single race (either white, black, American Indian or Alaska Native, or Asian or Pacific Islander) according to their combination of races, Hispanic origin, sex, and age indicated on the death certificate. The imputation procedure is described in detail at: http://www.cdc.gov /nchs/data/dvs/Multiple_race_docu_5-10-04.pdf.
Population bases for computing rates Reflecting the new guidelines issued in 1997 by the Office of Management and Budget (OMB), the 2000 census included an option for individuals to report more than one race as appropriate for themselves and household members (6). Death certificates for 35 states and the District of Columbia collected only one race in the same categories as specified in the 1977 OMB guidelines (see section “2003 revision of the U.S. Standard Certificate of Death” in the “Technical Notes”) throughout 2004. In addition, those death certificate data did not report Asians separately from Native Hawaiians or Other Pacific Islanders. The death certificate data by race (the numerators for death rates) thus collected are therefore incompatible for most states with the population data collected in the 2000 census (the denominators for the rates). In order to produce national death rates for 2003 and 2004, it was necessary to “bridge” the reported population data for multiple-race persons back to single race categories. In addition, the census counts were modified to be consistent with the 1977 OMB racial categories; that is, to report the data for Asian persons and Native Hawaiians or Other Pacific Islanders as a combined category, Asian or Pacific Islanders, and to reflect age as of the census reference date. The procedures used to produce the “bridged” populations are described in separate publications (7,8). It is anticipated that “bridged” data will be used over the next few years for computing population-based rates. As more states collect mortality data for race according to the 1997 OMB guidelines (6), it is expected that use of the “bridged” populations can be discontinued.
Availability of mortality data References 1. Miniño A, Heron M, Smith B. Deaths: Preliminary data for 2004. National vital statistics reports, Hyattsville, MD. National Center for Health Statistics. Forthcoming. 2. Technical Appendix. Vital statistics of the United States: Mortality, 1999. National Center for Health Statistics. Available from: http://www.cdc.gov/nchs/datawh/statab/ pubd/ta.htm.
3. 2003 revision of the U.S. Standard Certificate of Death. National Center
for Health Statistics. 2003. Available from: 4. Tolson G, Barnes J, Gay G, Kowaleski J. The 1989 revision of the U.S. standard certificates and reports. Vital Health Stat 4(28: National Center for Health Statistics. 1991. 5. Report of the Panel to Evaluate the U.S. Standard Certificates. National Center for Health Statistics. 2000. Available from: http://www.cdc.gov/nchs/data/dvs/ panelreport_acc.pdf. 2000. 6. Revisions to the standards for the classification of Federal data on race and ethnicity. Federal Register 62FR58782-58790 (58790): Office of Management and Budget. 1997. Available from: http://www.whitehouse.gov/omb/fedreg/ombdir15.html. 7. Ingram DD, Parker JD, Schenker N, et al. United States census 2000 population with bridged race categories. Vital Health Stat 2(135). 2003. 8. Schenker N, Parker J. From single-race reporting to multiple-race reporting: Using imputation methods to bridge the transition. Stat Med 22 1571-87. 2003.
Suggested citation
Acknowledgments
This page last reviewed October 15, 2008
|