| Climate has, for decades, been considered the collective state of the earth's atmosphere at a specific place for a long period of time. While a complete description should include a measure of climate variability, the average or "normal" conditions have come to be accepted as the standard descriptor of climate (Guttman, 1989). By international agreement, the normal climate is defined as the statistical average over a time period usually consisting of three consecutive decades (WMO, 1984).
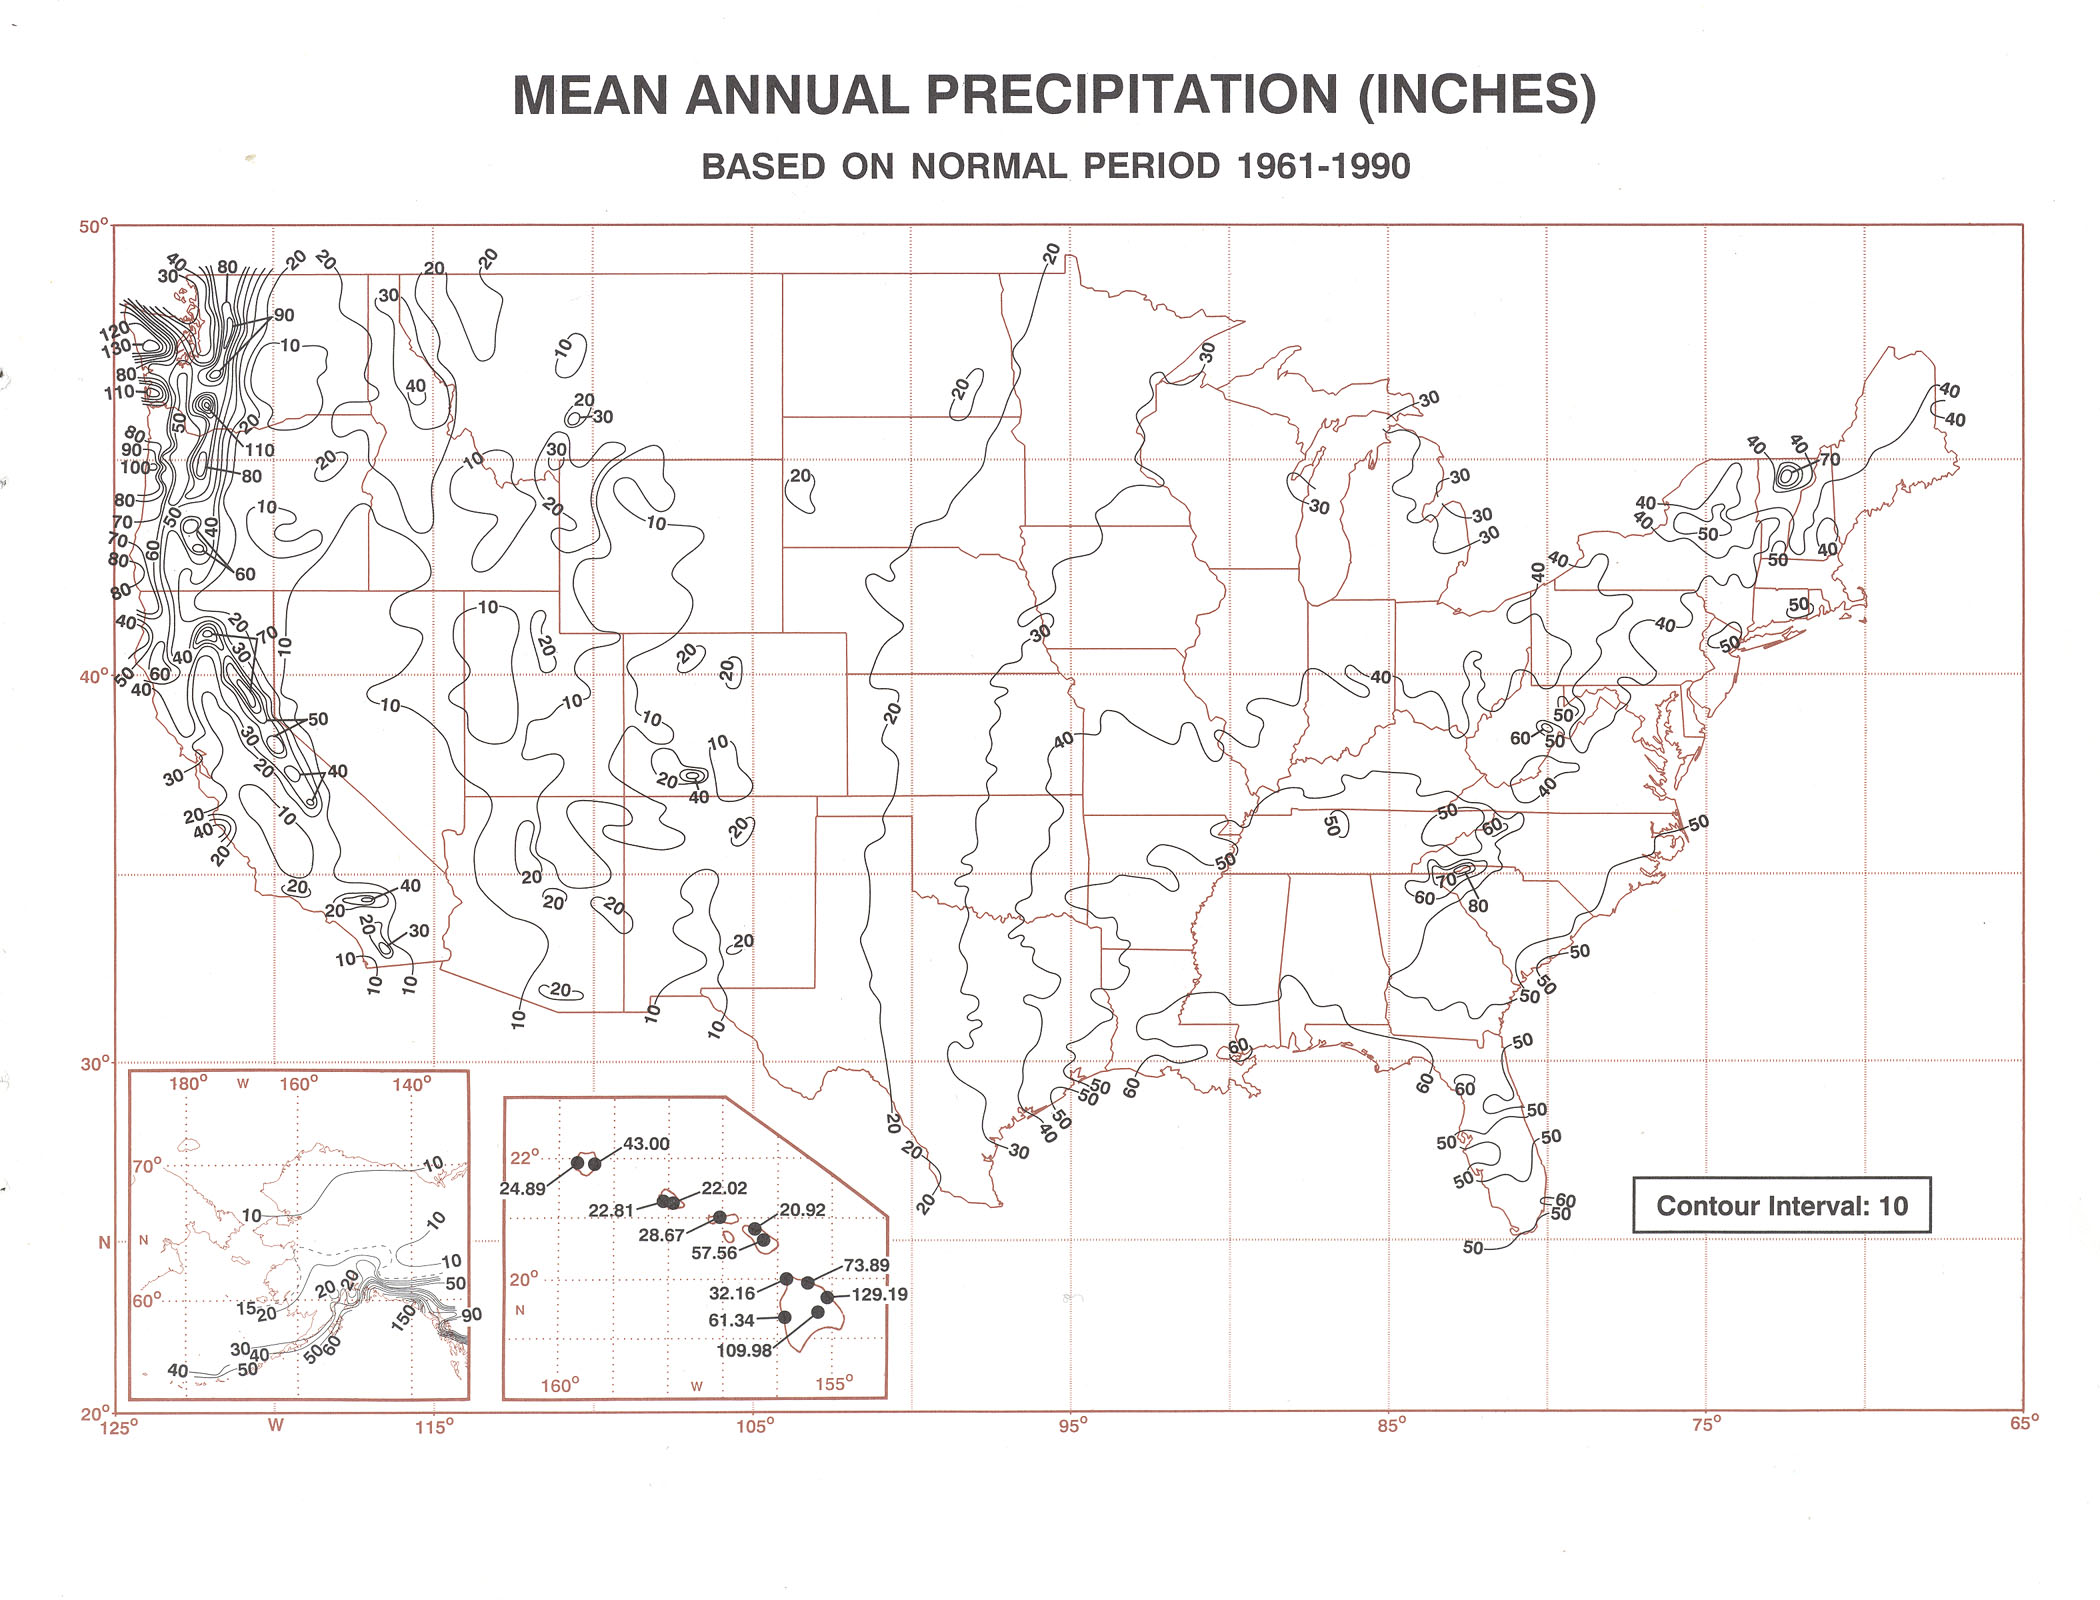
The purpose of this Supplement is to depict the geographic distribution of the annual climate of the United States (including the 48 contiguous States, Alaska, and Hawaii). The climatic elements depicted include annual mean temperature, annual total precipitation, annual heating degree days, and annual cooling degree days. Temperature and degree days are in °F and precipitation is in inches. Degree days are to the base 65°F.
The manual analysis is based on the 1961-90 normals from cooperative first order, and principal climatological stations (Owenby and Ezell, 1992). Because of the station density and the scale of the topography, the analysed isopleths are somewhat generalised and may depart to some extent from actual local conditions. Such factors as local topography, sharp changes in elevation, slope of the land, soil type, vegetative cover, proximity to water (oceans, rivers, lakes, ponds, marshes, etc.), when interpolating values for specific locations.
Several quality assurance and inhomogeneity adjustment procedures were applied to the station data before the normal values were computed. These procedures are described in the publication, Environmental Information Summary C-23: 1961-90 Climatic Normals. The methodology used to compute the heating and cooling degree day values is described in Owenby et al. (1992).
|


