   |
| |
 |
|||||||
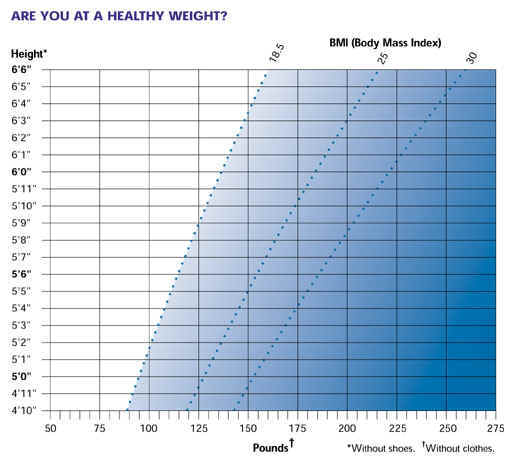
Body Mass Index Chart
BMI measures weight in relation to height. The BMI ranges shown above are for adults. They are not exact ranges of healthy and unhealthy weights. However, they show that health risk increases at higher levels of overweight and obesity. Even within the healthy BMI range, weight gains can carry health risks for adults. Directions: Find your weight on the bottom of the graph. Go straight up from that point until you come to the line that matches your height. Then look to find your weight group.
Source: Report of the Dietary Guidelines Advisory Committee on the Dietary Guidelines for Americans, 2000, page 3. |
||||||||
Updated March 12, 2004
FDA Home Page | Search FDA Site | FDA A-Z Index | Contact FDA | Privacy | Accessibility