For more than a century, public-spirited citizens all across the
country have performed an invaluable service by participating in
a network of volunteer observers managed by the federal government.
The Cooperative Observer Network is the nation's largest and oldest
weather network. The cooperative network was established in 1890
to make meteorological observations and establish and record climate
conditions in the United States , primarily for agricultural purposes.
Today the network is increasingly used by the National Weather Service
(NWS) to support meteorological and hydrological forecasts and warnings
and too verify forecasts.
The NWS proposes to modernize its Cooperative Observer Program (COOP).
The COOP has evolved into a nationwide weather and climate monitoring
network comprised of volunteer citizens and institutions observing
and reporting weather elements on a scheduled basis. The data provided
by this network is used in many ways: management of water resources,
the design and maintenance of buildings, predictions of crop yield,
used in economic decision making, flood and drought monitoring and
forecasting and the study of climate variability. Modernization of
the COOP network will be accomplished in two phases.
Background
The COOP network forms the backbone of temperature and precipitation
(including snowfall) observations describing the United States climate.
This network of 11,400 volunteer weather observers is located at
non-airport locations where people live, work, play, and grow their
food. Locations include urban, subuNovember 2, 2007ional, state, and local park settings. This network, and about
1,000 Automated Surface Observing System (ASOS) airport stations,
forms the federal government surface weather and climate observing
network for the United States . Participants are provided with a
set of simple weather instruments and observing instructions by the
NWS, which manages the network.
With a few exceptions, the instruments used by cooperative observers
have not changed significantly over the past century. Of the currently
operating 11,400 COOP stations, about 5,000 make up the "climate" network.
The remaining 6,400 cooperative stations support hydrology requirements.
Climate stations report 24-hour maximum and minimum temperatures,
liquid equivalent of precipitation, snowfall, snow depth, and other
special phenomena such as days with thunder, hail, etc. Hydrologic
stations report liquid equivalent of precipitation and may also observe
river water level heights, 24-hour maximum and minimum temperature,
snowfall, snow depth, evaporation, and other parameters.
ASOS airport observations remain the data set used by customers
simply because the data are available near real-time on an hourly
basis. COOP observations, although eight times more numerous and
sited at much more diverse environmental locations, in most cases,
are not available for weeks or months after the observations are
taken.
ASOS reports in near real-time to support aviation, hydrologic forecasting,
weather analysis, and weather prediction. Many are located at or
near major metropolitan airports. Most airports have a history of
site relocations and instrument changes and/or are located within
changing urban environments which has degraded the continuity of
the long-term data. In addition, urbanization and the resulting heat
island influence (artificial warming) has made airport data complicated
to use due to the poor data continuity. The much denser COOP network
has been stable as compared to the airport stations.
Need to Modernize the COOP
The sensitivity of our nation's citizenry, property, and economy
to damaging weather and climate anomalies continues to grow as does
its population and economy. Stories of disastrous weather and climate
related impacts at the local, regional, and even national levels
are all to frequent. In recent years, floods have been documented
to cost the nation hundreds of lives and billions in property damage.
Ironically, at the same time, devastating droughts have decimated
regional and local economies with tens of billions in property damage,
lost wages, and reduced productivity. Snowstorms have paralyzed some
states for days, resulting in loss of life, economic productivity,
and many other socio-economic hardships. Great swings in temperature-related
heating requirements between the mild winter of 1999-2000 and the
cold winter of 2000 inflicted hardship on heating customers, affecting
the nation's economy.
Such disasters require government assistance through mitigation
and corporate risk management. The decision-making process currently
relies on an airport surface observation network. To better support
efforts to reduce impacts and manage risks, we must modernize our
nation's ability to monitor weather and climate with greater resolution
and frequency.
Modernization of the COOP network has been formally recommended
as a high national priority by the following groups:
- NWS (1993)
- National Research Council (1998)
- American Association of State Climatologists (1999)
- National Drought Policy Commission (2000)
COOP Modernization
The NWS proposes to modernize the COOP in two phases. Phase 1 focuses
on replacement of obsolete equipment and determining optimum network
size and distribution and PhasNovember 2, 2007
Phase 1 started in fiscal year 2001 (FY01) with $400,000 to begin
the rescue of obsolete equipment. The funding of Phase 1 will continue
through FY02 and beyond until Phase 1 is complete. Phase 1 is projected
to cost $6.9 million over three years. This effort mitigates potential
failures at existing sites, thus avoiding any compromise of the nation's
longest and the world's best surface weather record. In Phase 1,
NWS plans to replace paper punch mechanisms in the network of 2,700
Fischer & Porter rain gauges. The NWS also plans to replace 5,000
obsolete Maximum-Minimum Temperature Systems. Later phases of the
modernization will address the issues of instrument improvement and
automated collection and distribution of observations. This phase
of the modernization is critical to maintaining NOAA's ability to
monitor and analyze climate and weather variability.
Phase 2 is proposed to begin in FY 2003 and will introduce improved
sensors and automatic collection and distribution of observational
data. Starting in mid-FY 2003, new modular automated equipment will
be procured and installed at 325 locations. Deployments will increase
to 1,130 annually by FY05 and continue until the complete network
is modernized.
COOP modernization will provides the nation with an integrated surface/hydro
meteorological monitoring network allowing for unprecedented real-time
monitoring of weather and climate conditions.
The COOP modernization will fill gaps in the coverage of the existing
COOP network, increase snowfall density and reporting coverage, improve
river stage (height) forecast accuracy, provide for better temperature
forecasts based on improved sensor distribution, and improve data
availability.
The COOP modernization also provides considerable economic benefit.
For example, improved temperature forecasts can potentially save
the nation hundreds of millions in wasted electric consumption as
each one degree Fahrenheit change in temperature equates to about
$1 billion in temperature related heating consumption. The COOP modernization
projects a 1.5 degree Fahrenheit improvement in local temperature
forecasts related to adding 3-hourly temperature forecasts for the
additional 8,000 modernized COOP sites. Better risk and water/drought
management and economic decisions made by industry, government, and
private citizens are other substantial benefits derived from a modernized
COOP network.
COOP modernization will be guided by a network spatial density study
conducted to identify weather and climate requirements of NOAA, its
federal partners, including the aforementioned agencies, and its
customers. The study will integrate the network design of the previously
mentioned federal surface observing networks to insure stations and
observations taken are designed in the most scientific and economical
manner.
In summary, the COOP modernization will meet the following requirements:
- Setting 20 x 20 mile grids (target: 8,000 stations), with increased
density in the West/Alaska
- Making hourly temperature and precipitation data (resolution
of 0.01 inch) available in near real- time
- Obtaining 24-hour snowfall and snow depth daily
- Transmitting, storing, disseminating and archiving data electronically
- Measuring soil temperature, moisture, relative humidity, and
evaporation in agriculturally sensitive areas to support USDA's
requirements.
Additionally, COOP observations will have centralized near real-time
Internet data access for observations.
Modernization Benefits
When fully implemented, COOP modernization will provide many benefits
including:
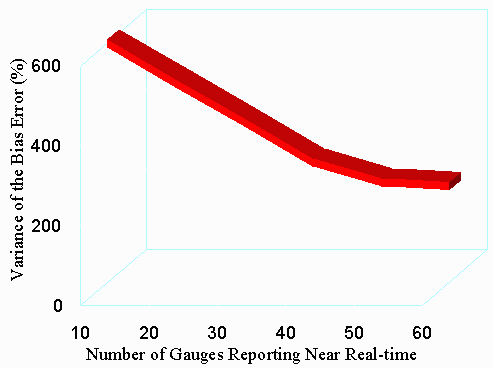
Figure 1: Reduction in the WSR-88D radar precipitation error resulting
from increasing the number of hourly reporting rain gauges from 10
to 50 (adding 40 COOPs).
Improve NWS's capability to monitor flood, drought and climate variability
by increasing surface non-airport reports of daily temperature, all-season
liquid precipitation (0.01" resolution) and 24-hour snowfall
summary reports by daily receipt of at least one report per element
per 20 by 20 mile grid, allowing for a 33 percent improvement in
the accuracy and the resolution of the U.S. Drought Monitor and the
Seasonal U.S. drought Outlook:
- Provide NWS forecasters, customers and partners with near real-time
standardized, hourly temperature, liquid precipitation (0.01" resolution),
and 24-hour daily snowfall observations
- Provide data with a resolution needed to improve local temperature
forecasts by 1.5 degrees Fahrenheit,
- Improve accuracy of flood forecasts by 23 percent
- Provide NWS forecasters, customers and partners electronic daily
maximum and minimum temperature, liquid precipitation, and 24-hour
snowfall for at least two NWS supervised non-airport locations
per zone
- Improve Stage 1 one-hour summer WSR-88D radar rainfall bias corrections
by up to 60 percent
- Increase observation availability for hourly temperature and
precipitation and daily 24-hour snowfall and snow depth observations
- Eliminate daily and monthly temperature biases at all COOP temperature
sites, resulting in several degrees (F) improvement in data comparability
- Eliminate uncertainty in day of occurrence for current 24-hour
reported maximum and minimum daily COOP temperatures for all modernized
COOP locations
- Improve COOP precipitation data quality by 20 percent
- Improve COOP Climatological Data publication (from the National
Climatic Data Center ) availability by 50 percent (1 month)
- Measure soil moisture and temperature, relative humidity, and
evaporation measurements at a 60-by-60 mile grid resolution for
improved drought monitoring.
Real-time access to hourly COOP network precipitation observations
will allow for the first time, real-time corrections for invaluable
precipitation estimate biases for weather radars, reducing the WSR-88D
precipitation bias error by up to 60%. This will be accomplished
by increasing the number of hourly rain gauge reports to support
the radar calibration from the current average of 10 per radar (ASOS)
to 50 (10 ASOS + 40 COOPs) (Figure 1).
Real-time surface observations will open up broad new opportunities
for private sector decision-makers to mitigate adverse impacts and
realize economic advantages in developing weather and climate scenarios.
The latter will be particularly true for rapidly-expanding applications
in the insurance, reinsurance, and weather risk management industries.
Accurate six month forecasts of El Nino and its impacts by the NOAA's
Climate Prediction Center combined with the deregulation of energy
production has brought significant market forces to the utility industry.
During the past two years, NOAA and the weather risk management industry
have participated in industry sponsored workshops and have ultimately
lead to the establishments of Cooperative Research and Development
Agreements. COOP provides the largest and best (and one of the longest)
comprehensive national weather and climate observing network in the
world and provides vital support to NOAA, NWS, industry, government
and customers.
Use of COOP observations has been demonstrated to improve temperature,
precipitation, and snowfall forecast accuracy at the local county
level. Thus, making COOP observations available nationally in a timely
fashion will significantly increase the NWS's ability to accurately
detect and forecast weather at the county level and provide customers
with a much needed data set representative of where the nation's
citizenry live, work, play, and grow their food.
Real-time COOP data is the most spatially detailed surface data
providing Weather Forecast Offices with the essential, basic observations
required for accurate local forecasts and forecast verification.
Better gauges will eliminate 20%-40% of site reporting error rates
on the B-91 climatological record forms, published by NCDC for customers.
Additionally, users will be able to access the forms in near-real
time, unlike present capabilities when up to 4% of the forms are
missing and received at least 25 days after the fact.
Academic and NWS studies have shown the COOP data can improve forecast
accuracy by 1.5 degrees F for local forecast and also allow for the
first time, local forecast verification.
The addition of 8,000 hourly COOP precipitation reports in near
real time is expected to improve the NWS's accuracy of river stage
forecasts significantly (figure 3).
Summary
The COOP network has been very successful in meeting its original
1890 agriculturally oriented mission. However, many other uses of
the data have since emerged. These applications include climate change
and variability, water management, drought assessment, environmental
impact assessment, litigation, engineering and architectural design,
energy consumption studies/models, crop yield forecasts, and NWS
local forecasts, warnings, and verification.
Recently, high value applications of the data for use in energy
industry (i.e., load forecasting) ($500 B) and the expanding Weather
Risk Management Industry ($10 B) have been discussed. Many of these
applications require both historical climate data and timely access
to current observations.
In summary, there is an exploding demand for higher density, real-time
surface data by weather-sensitive industries and private and public
weather services. The demand far exceeds the NWS's current capabilities.
The COOP network needs to be modernized.