 |
Graphics, Photos, and Charts |
|
|
|
|
Figures from the CDC Fact Sheet: Estimates of New HIV Infections in the
United States
|
|
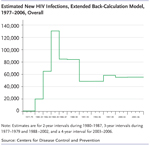
Figure 1. Estimated New HIV Infections, Extended
Back-Calculation
Model, 1977–2006, Overall
High Resolution Version
This figure shows the overall estimated new HIV infections from
1977 to 2006, using the extended back-calculation model. The
estimates are for 2-year intervals during 1980–1987, 3-year
intervals during 1977–1979 and 1988 –2002, and a 4-year interval
for 2003–2006. |
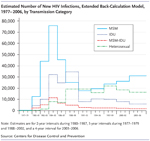 |
Figure 2. Estimated Number of New HIV Infections, Extended
Back-Calculation Model, 1977– 2006, by Transmission Category
High Resolution Version
This figure shows the estimated new HIV infections by
transmission category from 1977 to 2006, using the extended
back-calculation model. The estimates are for 2-year intervals
during 1980–1987, 3-year intervals during 1977–1979 and 1988
–2002, and a 4-year interval for 2003–2006. The transmission
categories are men who have sex with men (MSM), injection drug
use (IDU), MSM-IDU, and high-risk heterosexual. |
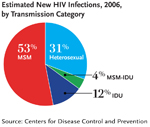 |
Figure 3. Estimated New HIV Infections, 2006, by Transmission
Category
High Resolution Version
This pie chart, figure 3, shows the estimated new HIV infections
in 2006 by transmission category. Men who had sex with men or
MSM accounted for 53 percent, high-risk heterosexual accounted
for 31 percent, injection drug user or IDU accounted for 12
percent and cases that were both MSM and IDU accounted for 4
percent of the estimated new HIV infections in 2006. |
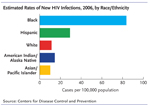 |
Figure 4. Estimated Rates of New HIV Infections, 2006, by
Race/Ethnicity
High Resolution Version
This bar chart shows the estimated rates of new HIV infections
in 2006 by Race/Ethnicity. Rates shown on the chart include:
83.7 new infections per 100,000 population among blacks, 29.3
new infections per 100,000 population among Hispanics, and 11.5
new infections per 100,000 population among whites in 2006.
American Indians/Alaska Natives has 14.6 new infections per
100,000 population, and Asians/Pacific Islanders had 10.3 new
infections per 100,000 population. |
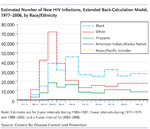 |
Figure 5: Estimated Number of New HIV Infections, Extended Back-Calculation Model, 1977-2006, by Race/Ethnicity
High Resolution Version
This figure shows the estimated new HIV infections by
race/ethnicity category from 1977 to 2006, using the extended
back-calculation model. The estimates are for 2-year intervals
during 1980–1987, 3-year intervals during 1977–1979 and 1988
–2002, and a 4-year interval for 2003–2006. Race/Ethnicities
included in the figure are Blacks, Hispanics, Whites,
Asians/Pacific Islanders and American Indians/Alaska Natives. |
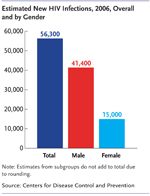 |
Figure 6. Estimated New HIV Infections, 2006, Overall and by
Gender
High Resolution Version
This bar chart shows the estimated new HIV infections in 2006 by
gender and overall. Overall, there were 56,300 new cases of HIV
infection in 2006. Men accounted for 41,400 new cases, women
accounted for 15,000 new cases. Estimates from subgroups do not
add to total due to rounding. |
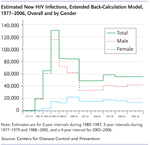 |
Figure 7. Estimated New HIV Infections, Extended
Back-Calculation Model, 1977-2006, Overall and by Gender
High Resolution Version
This figure shows the estimated new HIV infections by gender
from 1977 to 2006, using the extended back-calculation model.
The estimates are for 2-year intervals during 1980–1987, 3-year
intervals during 1977–1979 and 1988 –2002, and a 4-year interval
for 2003–2006. |
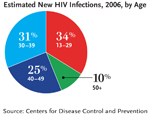 |
Figure 8. Estimated New HIV Infections, 2006, by Age
High Resolution Version
This pie chart shows the estimated new HIV infections in 2006 by
age. In 2006, persons ages 13 to 29 accounted for 34 percent of
new HIV infections, persons ages 30 to 39 accounted for 31
percent of new HIV infections, persons ages 40 to 49 accounted
for 25 percent of new HIV infections, and those more than 50
years of age accounted for 10 percent of new HIV infections. |
Last Modified:
08/01/2008
Last Reviewed: 08/01/2008
Content Source:
National Center for HIV/AIDS, Viral Hepatitis,
STD, and TB Prevention
|