Event CategoriesYear 2008 Storm Events
Year 2007 Storm Events
Year 2006 Storm Events
Year 2005 Storm Events
Year 2004 Storm Events
Year 2003 Storm Events
Year 2002 Storm Events
Year 2001 Storm Events
Year 2000 Storm Events
Archival Imagery
2009 Regional Imagery
2008 Regional Imagery
2007 Regional Imagery
2006 Regional Imagery
2005 Regional Imagery
2004 Regional Imagery
2003 Regional Imagery
2002 Regional Imagery
2001 Regional Imagery
2001 Regional Analyses
2000 Regional Imagery
2000 Regional Analyses
1999 Tropical Storm Summary
Home
NOAA Satellite and Information Service Home Page NOAA's All Hazards Monitor Where in the World is Tomorrow Now? NOAA National Hurricane Center NOAA Satellite Services Division Geostationary Satellite Server nowCOAST GIS Mapping Portal to Real-Time Environmental Observations and NOAA Forecasts Operational Significant Event Imagery Defense Meteorological Satellite Program NCDC Climate of 2008 FAQ: Hurricanes, Typhoons And Tropical Cyclones Visualization Lab Support |
The Environmental Visualization Program provides enhanced resolution imagery, animations and graphic design services to NOAA, the media and the public.
We are an affiliate organization to STAR, the NOAA Satellite and Information Service Center for Satellite Applications and Research.
The products provided here are public domain and therefore may not be copyrighted.
Please credit NOAA for any products. Include "copyright 2007 EUMETSAT" on all METEOSAT imagery.
Most Recent Visualizations...
The following imagery
is updated as frequently as possible.
For daily imagery not found below, use the search box
to the left. Enter today's date, in the format YYYY.MM.DD, and hit return. For realtime imagery please visit the NOAA Satellite and Information Service.
For more imagery and animations please visit the Environmental Visualization Program Educational Collection.
| Midwestern United States regional imagery, 2009.01.13 at 1800Z. Centerpoint Latitude: 36:49:00N Longitude: 82:01:51W.
Latitude: 36.82
Longitude: -82.02
Data Elements: A low pressure system moving over parts of the Midwestern United States. This system is producing snow and gusty winds over the region.
Observation Device: GOES-11 1 km visible imagery.
View our larger 1280 X 960
picture! | 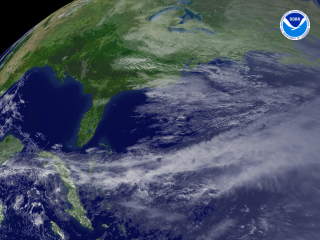
| Northeastern United States regional imagery, 2009.01.08 at 1800Z. Centerpoint Latitude: 39:02:41N Longitude: 76:36:06W.
Latitude: 39.04
Longitude: -76.60
Data Elements: Part of a low pressure system remains over the Northeastern United States, producing a wintry mix.
Observation Device: GOES-11 1 km visible imagery.
View our larger 1280 X 960
picture! | 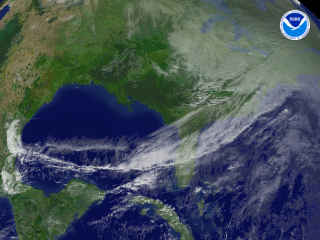
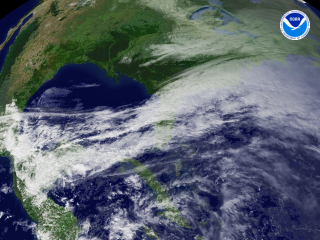
| Eastern United States regional imagery, 2009.01.07 at 1800Z. Centerpoint Latitude: 37:36:54N Longitude: 78:35:39W.
Latitude: 37.62
Longitude: -78.58
Data Elements: A low pressure system lingering over the Eastern United States. This system is producing a wintry mix over parts of the the Northeast and heavy rain over parts of the South.
Observation Device: GOES-11 1 km visible imagery.
View our larger 1280 X 960
picture! | 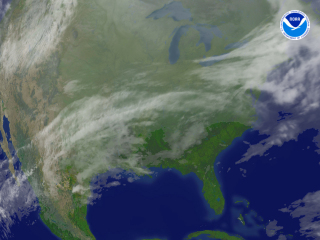
| Midwestern United States regional imagery, 2009.01.05 at 1200Z. Centerpoint Latitude: 35:07:05N Longitude: 91:25:12W.
Latitude: 35.12
Longitude: -91.42
Data Elements: A low pressure system moving over parts of the Southern, Midwestern and Northeastern United States. This system is producing heavy rain, snow and freezing rain over parts of theses regions.
Observation Device: GOES-11 4 km infrared imagery.
View our larger 1280 X 960
picture! | 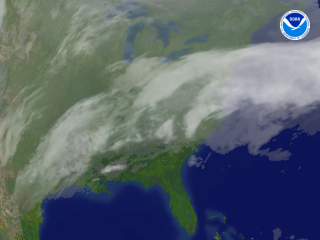
| Northeastern United States regional imagery, 2009.01.06 at 1200Z. Centerpoint Latitude: 36:42:44N Longitude: 85:27:50W.
Latitude: 36.71
Longitude: -85.45
Data Elements: A low pressure system moving over parts of the Southern, Midwestern and Northeastern United States. This system is bringing heavy rain to parts of the South and a wintry mix to the Midwest and Northeast.
Observation Device: GOES-11 4 km infrared imagery.
View our larger 1280 X 960
picture! | 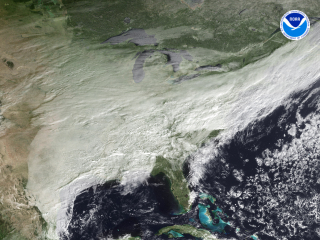
| Central United States regional imagery, 2008.12.16 at 1445Z. Centerpoint Latitude: 39:09:07N Longitude: 83:42:17W.
Latitude: 39.15
Longitude: -83.70
Data Elements: A low pressure system moving over parts of the Midwestern, Southern and Eastern United States. This system is producing rain and snow over parts of these regions.
Observation Device: GOES-13 1 km visible imagery.
View our larger 1280 X 960
picture! | 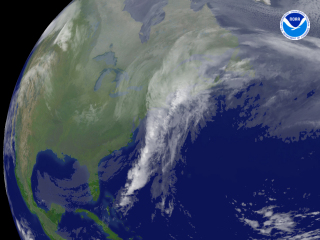
| Northeastern United States regional imagery, 2008.12.12 at 1145Z. Centerpoint Latitude: 42:22:53N Longitude: 73:59:49W.
Latitude: 42.38
Longitude: -73.98
Data Elements: The low pressure system responsible for the wintry weather yesterday, is continuing to move northeast.
Observation Device: GOES-12 4 km infrared imagery.
View our larger 1280 X 960
picture! | 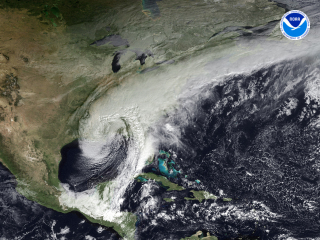
| Eastern United States regional imagery, 2008.12.11 at 1445Z. Centerpoint Latitude: 35:09:13N Longitude: 78:15:34W.
Latitude: 35.15
Longitude: -78.25
Data Elements: A massive low pressure center is bring heavy mixed precipitation to the Eastern Seaboard from Florida to New England.
Observation Device: GOES-12 1 km visible imagery.
View our larger 1280 X 960
picture! | |