 |
|
|
|
|
|
|
|
|
|
|
|
|
|
|
|
|
||||
| ||||||||||
|
|
|
|
Self-Rated Fair or Poor Health Among Adults with Diabetes --- United States, 1996--2005Diabetes mellitus affects nearly 21 million persons in the United States (1). Maintaining and improving health-related quality of life among persons with diabetes is a public health goal. Healthy People 2010 includes self-rated health as one of three surveillance tools that can be used to measure health-related quality of life (2). To assess the prevalence of self-rated fair or poor health among U.S. adults with diabetes and to identify factors associated with fair or poor health, CDC analyzed 1996--2005 Behavioral Risk Factor Surveillance System (BRFSS) data. This report summarizes the findings of that analysis, which indicated that self-rated fair or poor health was three times more common among adults with diabetes than among those without diabetes and that the prevalence increased during 1996--2005 among young adults (i.e., aged 18--44 years) with diabetes. The results underscore the need for 1) continued interventions to promote healthy behaviors and prevent diabetes and 2) interventions for persons with diabetes to help them better manage their diabetes and prevent diabetes complications, which can increase their perceived quality of life. BRFSS is an ongoing, state-based, random-digit--dialed telephone survey of the U.S. civilian, noninstitutionalized population aged >18 years; the survey is conducted in all 50 states, the District of Columbia, and three U.S. territories. The median state response rate (i.e., the percentage of persons who completed interviews among all eligible persons, including those who were not successfully contacted) was 63.1% (range: 45.6%--87.1%) in 1996 and 51.1% (range: 34.6%--67.4%) in 2005. The median cooperation rate (i.e., percentage of persons who completed interviews among all eligible persons who were contacted) was 68.2% (range: 46.1%--91.4%) in 1996 and 75.1% (range: 58.7%--85.3%) in 2005. Persons with diabetes were defined as respondents who answered yes to the question, "Have you ever been told by a doctor that you have diabetes?" Women who were told that they had diabetes only during pregnancy and respondents with prediabetes or borderline diabetes were classified as not having diabetes. Persons with fair or poor health status were defined as those who responded "fair" or "poor" to the question, "Would you say that in general your health is excellent, very good, good, fair, or poor?" Respondents who reported "don't know/not sure" or "refused" were excluded from the analysis. Age-adjusted prevalence was estimated according to the 2000 U.S. standard population. Linear regression analysis was used to assess the trend of self-rated fair or poor health during 1996--2005. Logistic regression analysis was conducted to examine the association between self-rated fair or poor health and selected characteristics. Estimates were weighted to reflect the age, sex, and racial/ethnic distribution of the U.S. population. The statistical significance level was p<0.05. During 2005, an estimated 49.3% (95% confidence interval [CI] = 48.2%--50.5%) of adults with diabetes aged >18 years reported having fair or poor health. After adjusting for respondent age, the prevalence of fair or poor health among adults with diabetes was 46.7% (CI = 44.7%--48.7%), more than three times the rate among adults without diabetes (14.2%, CI = 13.9%--14.4%). During 1996--2005, no significant change was identified in the overall prevalence of self-rated fair or poor health among adults with diabetes, although the prevalence did vary by age group. The prevalence did not change for persons aged >45 years but increased significantly (21.9%) among those aged 18--44 years (from 35.6% in 1996 to 43.4% in 2005) (Figure). In 2005, the age-specific prevalence of fair or poor health was significantly lower among persons aged 18--44 years (43.4%, CI = 39.7%--47.0%) than among those aged 45--64 years (50.5%, CI = 48.9%--52.1%) or >75 years (52.1%, CI = 49.7%--54.6%) (Table). In addition, the age-adjusted prevalence was higher among women compared with men (51.1%, CI = 48.9%--53.3% vs 42.6%, CI = 39.2%--45.9%, respectively); among non-Hispanic blacks and Hispanics compared with non-Hispanic whites (49.9%, CI = 45.8%--53.9% and 59.8%, CI = 53.9%--65.7% vs 42.1%, CI = 39.9%--44.3%, respectively); among persons without health insurance coverage compared with those with coverage (56.7%, CI = 51.5%--61.9% vs 44.5%, CI = 42.5%--46.6%, respectively); among current smokers compared with nonsmokers (55.5%, CI = 51.7%--59.3% vs 44.4%, CI = 42.0%--46.8%, respectively); and among insulin users compared with those who did not use insulin (58.5%, CI = 54.1%--63.0% vs 43.3%, CI = 40.6%--46.0%, respectively). In addition, as level of education increased, the age-adjusted prevalence decreased. As duration of diabetes increased, prevalence also increased (Table). In multivariate analyses, the following characteristics were significantly associated with an increased risk for self-rated fair or poor health after adjusting for all other factors: being aged 45--64 years (odds ratio [OR] = 1.5), 65--74 years (OR = 1.4), or >75 years (OR = 1.6); Hispanic ethnicity (OR = 1.6); current smoking (OR = 1.7); obesity (OR = 1.4); duration of diabetes of >20 years (OR = 1.3); and insulin use (OR = 2.0) (Table). In contrast, the following factors were associated with a decreased risk: being a man (OR = 0.8), having a high school education (OR = 0.5) or more than a high school education (OR = 0.3), and having health insurance coverage (OR = 0.7). Reported by: L Pan, MD, Q Mukhtar, PhD, SL Geiss, MA, M Rivera, PhD, A Alfaro-Correa, PhD, R Sniegowski, MPH, Div of Diabetes Translation, National Center for Chronic Disease Prevention and Health Promotion, CDC. Editorial Note:Self-rated health status is a useful indicator of a population's overall well-being because lower ratings of health status have been associated with increased mortality and morbidity (3). Fair or poor health among persons with diabetes is also associated with the presence of diabetes-related complications such as lower extremity amputation, blindness, kidney failure, and cardiovascular disease (4). The finding that adults with diabetes are more than three times more likely to report fair or poor health than persons without diabetes likely reflects the effects of diabetes and its complications on quality of life. In contrast to older adults, the prevalence of fair or poor health increased during the past decade among young adults with diabetes. Additional research is needed to identify the factors related to this trend. Consistent with previous studies (4--6), self-rated fair or poor health correlates with certain health risk factors, illness severity, and certain sociodemographic characteristics. Health risk factors such as smoking and obesity are associated with fair or poor health, as are certain indicators of disease severity, such as insulin use and duration of diabetes. Among those with diabetes, subgroups such as older persons, women, Hispanics, persons with less than a high school education, and persons without health insurance coverage are more likely to report fair or poor health. The disparities among these subgroups might result from differences in the prevalence of diabetes-related complications; access to health-care services; quality of care received; and behavioral, social, or cultural factors. These disparities suggest the need for targeted interventions, such as promoting healthy behaviors through effective smoking cessation and weight-loss programs, improving diabetes management through preventive-care practices, and increasing access to health-care services. The findings in this report are subject to at least two limitations. First, BRFSS excludes persons who do not have landline telephones, thus the results might not be representative of certain segments of the U.S. population. Second, self-rated health is subjective, and psychosocial factors such as level of social support and beliefs about certain health behaviors can affect how persons respond to questions about self-rated health (7). However, the retest consistency of respondent self-rated health has been validated (8). Two of CDC's health protection goals are "live a healthy, productive, and satisfying life" and "live better, longer" (9). CDC provides funding, resources, and technical assistance to 59 diabetes prevention and control programs in the United States. Continued surveillance of the health status of persons with diabetes monitors the well-being of this population and the effectiveness of prevention strategies and provides data for public health agencies that are creating programs to promote population health. Collaboration among health-care systems, health-care providers, policymakers, and other organizations are needed to create interventions to improve the health of persons with diabetes. For example, diabetes education and counseling can improve patients' self-perceived health by enhancing their feelings of self-efficacy (7). The National Diabetes Education Program (NDEP), which is cosponsored by CDC and the National Institutes of Health, educates persons with diabetes about risk factors, raises public awareness of diabetes-related complications, and attempts to improve outcomes of diabetes through partnerships with other sectors of the U.S. health-care system. Additional information about NDEP is available at http://www.ndep.nih.gov. References
Table 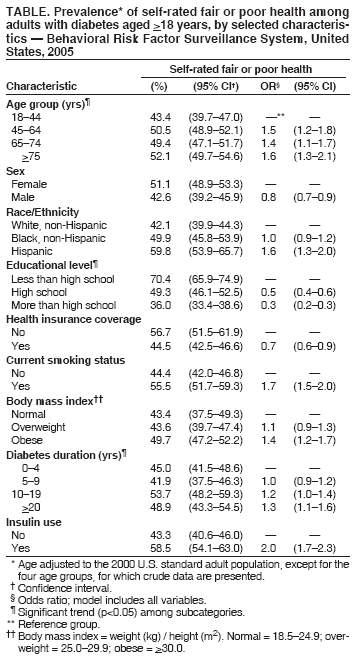 Return to top. Figure 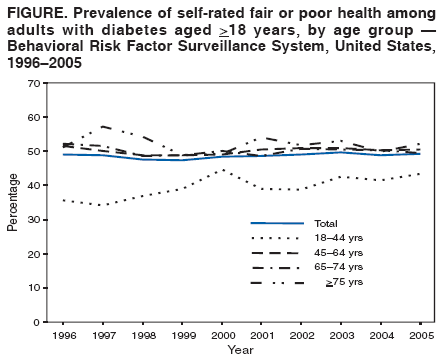 Return to top.
Disclaimer All MMWR HTML versions of articles are electronic conversions from ASCII text into HTML. This conversion may have resulted in character translation or format errors in the HTML version. Users should not rely on this HTML document, but are referred to the electronic PDF version and/or the original MMWR paper copy for the official text, figures, and tables. An original paper copy of this issue can be obtained from the Superintendent of Documents, U.S. Government Printing Office (GPO), Washington, DC 20402-9371; telephone: (202) 512-1800. Contact GPO for current prices. **Questions or messages regarding errors in formatting should be addressed to mmwrq@cdc.gov.Date last reviewed: 11/15/2006 |
|||||||||
|