| |
 This
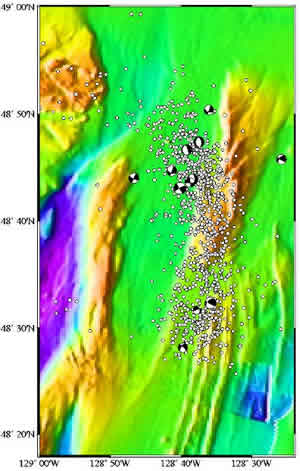
diagram shows earthquakes that occurred from Julian Day 250-272
(with lat & long errors of < 5 minutes) plotted on
top of detailed bathymetry of the northern JdFR. The earthquakes
have continued to propagate southward over time, and are now
locating within a few kms of the hydrothermal vents and drill
sites. The diagram also shows the focal mechanisms, derived
by from PGC,
of the largest earthquakes in the swarm. The mechanisms reflect
the complex tectonics of a triple junction, formed by the
intersection of the Sovanco Fracture Zone, northern Juan de
Fuca Ridge, and Nootka Fault. This
diagram shows earthquakes that occurred from Julian Day 250-272
(with lat & long errors of < 5 minutes) plotted on
top of detailed bathymetry of the northern JdFR. The earthquakes
have continued to propagate southward over time, and are now
locating within a few kms of the hydrothermal vents and drill
sites. The diagram also shows the focal mechanisms, derived
by from PGC,
of the largest earthquakes in the swarm. The mechanisms reflect
the complex tectonics of a triple junction, formed by the
intersection of the Sovanco Fracture Zone, northern Juan de
Fuca Ridge, and Nootka Fault.
Click
image for full-size view.
|
|