| |
(click
for full-size)

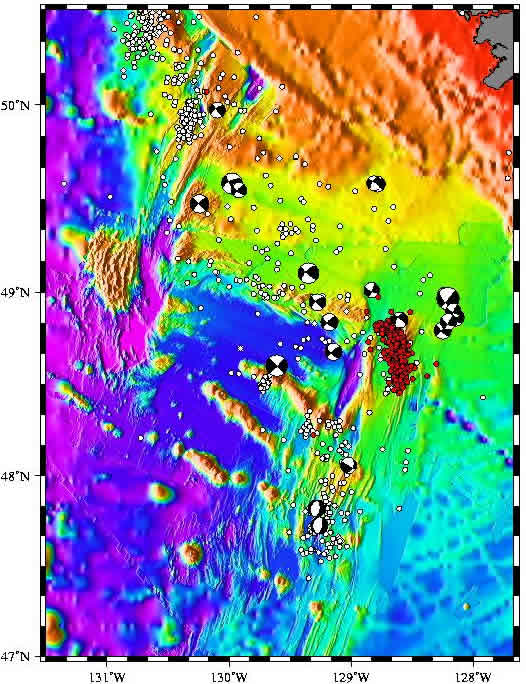
Fig. 1: Swarm epicenters with errors < 2 minutes and
historical epicenters.
Fig. 2: Time vs. distance plot of all events < 5 minutes
error.
Fig. 3: Time vs. distance plot of events < 5 min. error
and estimated migration rate. |
Event
Description :
The
land seismic network operated by the Pacific
Geoscience Center of the Geological Survey of Canada has
recorded and produced moment tensor solutions for several
of the larger events, indicating a mixture of normal and strike-slip
motion. Strike-slip events are oriented parallel to Juan de
Fuca orientation (15 deg) and are likely associated with the
ridge system. The complex interplay between the Nootka fault
and the JdF volcanic system results in a diffuse triple junction
with correspondingly complex stress fields. Further detailed
examination of the joint data sets will be required to unravel
the total picture. A response effort is being discussed by
the combined event response team funded by NSF and NOAA. A
detailed description of the site can be found in Davis, E.E.,
and H. Villinger, 1992, Proceedings of the Ocean Drilling
Program, Initial Reports, vol 139, pp 9-41.
Epicenter
Maps:
Figure
1 shows the epicenters with latitude and longitude errors
< 2 minutes. The epicenters seem to follow the structure
of the eastern middle valley faults and "wrap around"
the intersection with the Sovanco. Also comparing this with
an earlier plot, it looks like these latest events are generally
further south along Middle Valley than previous events.
Distance-time
Plots:
Migration
of earthquake epicenters during the Middle Valley earthquake
sequence. The earthquakes are plotted in distance relative
to an average location of the Dead
Dog and Bent Hill Vents and the ODP Holes 856,857,&858.
The earthquakes have clearly migrated southward along the
eastern section of Middle Valley during the 10 days of the
swarm, currently coming to within 5 km of the vents and drill
holes.
Figure 2 shows
events with latitude and longitude errors < 5 minutes and
Figure 3 shows same
events with an estimated migration rate.
|


