Statistics and Surveillance:
Maps/Figures 2000 Estimated Coverage by State
Estimated coverage for
| Map image | Figures only |
|---|---|---|
| Series 3:3:1 | map | figures |
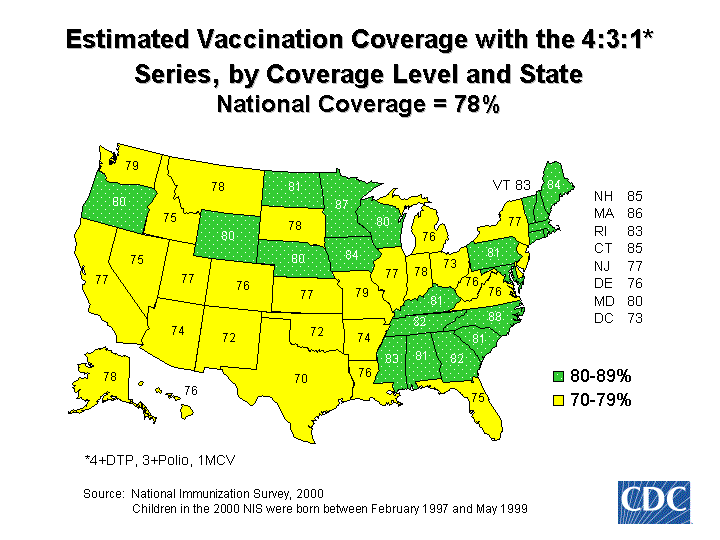
| Series 4:3:1 | map | figures |
| Series 4:3:1:3 | map | figures |
| Series 4:3:1:3:3 | map | figures |
| DTP, DTaP, or DT 4 or more doses | map | figures |
| DTP, DTaP, or DT 3 or more doses | map | figures |
| Hepatitis B 3 or more doses | map | figures |
| Hib 3 or more doses | map | figures |
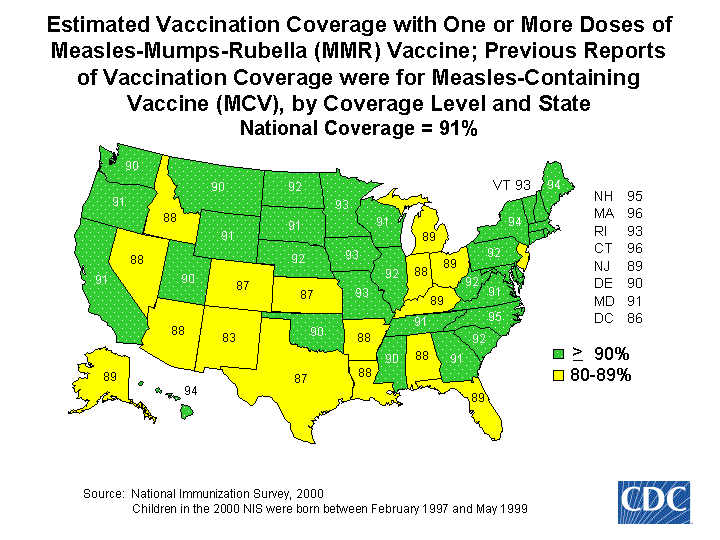
| MMR 1 or more doses | map | figures |
| Polio 3 or more doses | map | figures |
| Varicella 1 or more doses | map | figures |
This page last modified on August 28, 2002
Content last reviewed on August 28, 2002
Content Source: National Center for Immunization and Respiratory Diseases
Content last reviewed on August 28, 2002
Content Source: National Center for Immunization and Respiratory Diseases