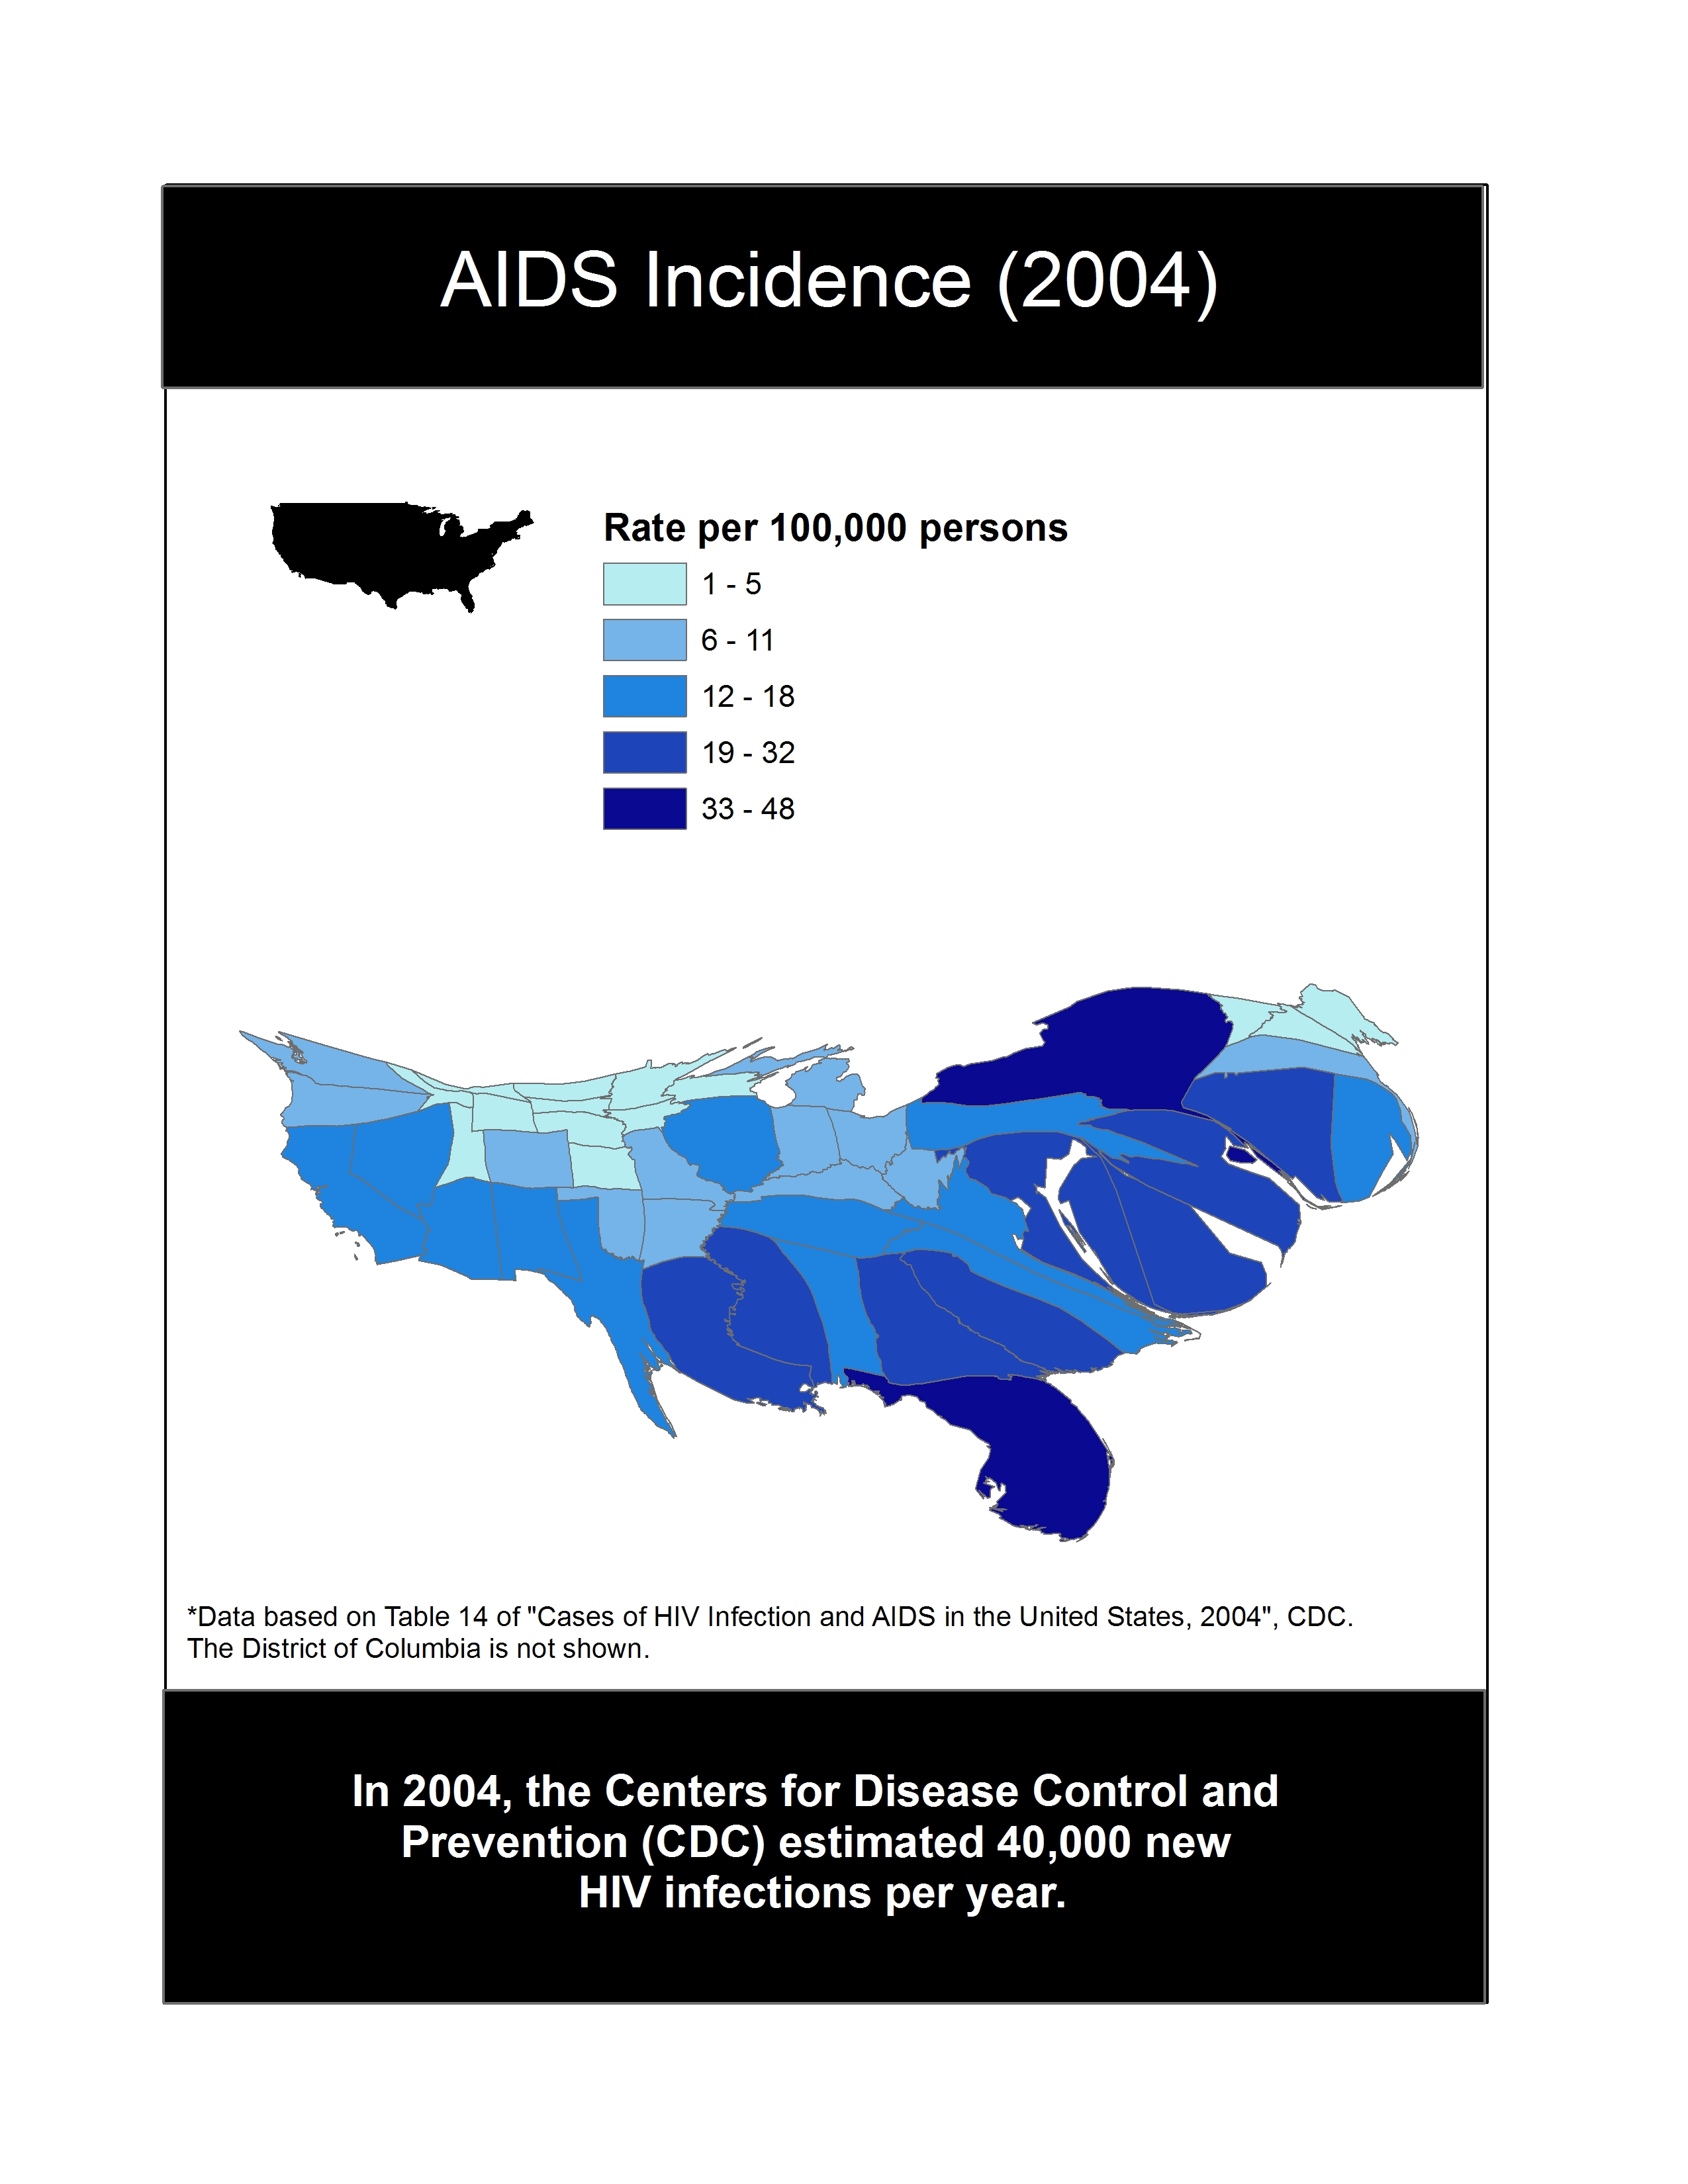
AIDS Incidence 2004
This map is called a cartogram and was created by Chris Delcher. The technique "reshapes" geography according to some value of interest. In this case, he chose to show the United States as it would look if state boundaries were shaped the incidence rate of AIDS in 2004. The uniqueness of this style draws attention to the extreme values and draws the reader into the data.
Page last modified: November 15, 2006