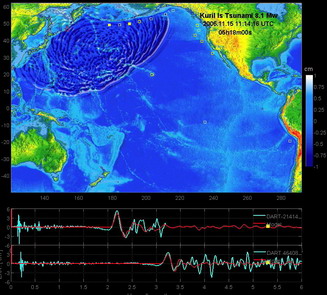
Research animations of the Nov 15, 2006 Kuril tsunami propagation created with experimental runs of the MOST tsunami forecast model and including DART® buoy data. Yellow squares indicate DART® buoy locations. Click the image to animate.
Propagation in the Pacific Ocean. Contact us for a high resolution version.
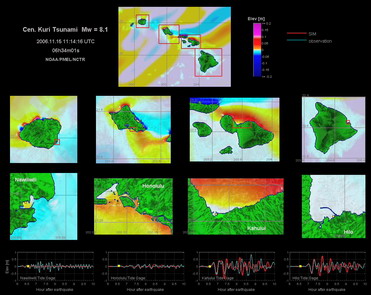
Propagation through the Hawaiian Islands.
The animations display qualitative information about the
tsunami propagation including tsunami wave interaction with ocean floor
bathymetric features, and neighboring coastlines. The tsunami radiation pattern is indicated with color coded information
about the maximum wave height at different locations throughout the Pacific
Ocean.
The timer and moving yellow squares indicate
time elapsed since time of the earthquake, providing an estimate of
tsunami arrival time at different locations.