(Reported to CDC as of December 16, 2008)
Click
here for a printer friendly version.
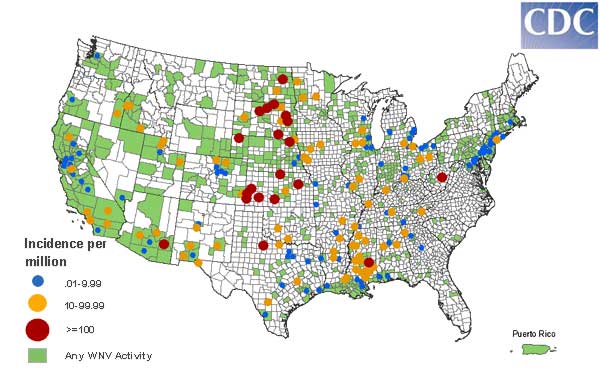
West Nile virus maps reflect surveillance reports released by state and local health departments to CDC's ArboNET system for public distribution. Map shows the distribution of human neuroinvasive disease (encephalitis and/or meningitis) incidence occurring during 2008 with number of human cases shaded according to incidences ranging from .01 to 9.99, 10 to 99.99, greater then 100 per million population, and WNV activity (human, mosquito, veterinary, avian and sentinel data).
USGS: http://diseasemaps.usgs.gov/
WNV Surveillance Maps detailing Neuroinvasive Disease Incidence additional years:
1999|2000|2001|2002|2003|2004|2005|2006|2007|2008