| Thumbnail |
Table/Figure Title |
Updated |
Downloads |
 |
Silicosis: Number of deaths, crude and age-adjusted death rates, U.S. residents age 15 and over, 1968–2004 (Ref.No. 2007F03-01) |
June 2008 |
image (.gif)
print (.pdf)
data (.csv) |
 |
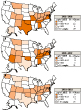
Silicosis: Age-adjusted death rates by state, U.S. residents age 15 and over, 1995–2004 (Ref.No. 2007F03-02) |
June 2008 |
image (.gif)
print (.pdf)
data (.csv) |
 |
Silicosis: Number of deaths by sex, race, age, and median age at death, U.S. residents age 15 and over, 1995–2004 (Ref.No. 2007T03-01) |
June 2008 |
image (.gif)
print (.pdf)
data (.csv) |
 |
Silicosis: Death rates (per million population) by race and sex, U.S. residents age 15 and over, 1995–2004 (Ref.No. 2007T03-02) |
June 2008 |
image (.gif)
print (.pdf)
data (.csv) |
 |
Silicosis: Years of potential life lost to age 65 and to life expectancy by race and sex, U.S. residents age 15 and over, 1995–2004 (Ref.No. 2007T03-03) |
June 2008 |
image (.gif)
print (.pdf)
data (.csv) |
 |
Silicosis: Number of deaths by state, U.S. residents age 15 and over, 1995–2004 (Ref.No. 2007T03-04) |
June 2008 |
image (.gif)
print (.pdf)
data (.csv) |
 |
Silicosis: Number of deaths, death rates (per million population), and years of potential life lost (YPLL) by state, U.S. residents age 15 and over, 1995–2004 (Ref.No. 2007T03-05) |
June 2008 |
image (.gif)
print (.pdf)
data (.csv) |
 |
Silicosis: Most frequently recorded industries on death certificate, U.S. residents age 15 and over, selected states and years, 1990–1999 (Ref.No. 2007T03-06) |
June 2008 |
image (.gif)
print (.pdf)
data (.csv) |
 |
Silicosis: Most frequently recorded occupations on death certificate, U.S. residents age 15 and over, selected states and years, 1990–1999 (Ref.No. 2007T03-07) |
June 2008 |
image (.gif)
print (.pdf)
data (.csv) |
 |
Silicosis: Proportionate mortality ratio (PMR) adjusted for age, sex, and race by usual industry, U.S. residents age 15 and over, selected states and years, 1990–1999 (Ref.No. 2007T03-08) |
June 2008 |
image (.gif)
print (.pdf)
data (.csv) |
 |
Silicosis: Proportionate mortality ratio (PMR) adjusted for age, sex, and race by usual occupation, U.S. residents age 15 and over, selected states and years, 1990–1999 (Ref.No. 2007T03-09) |
June 2008 |
image (.gif)
print (.pdf)
data (.csv) |
 |
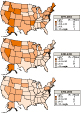
Silicosis: Age-adjusted death rates by county, U.S. residents age 15 and over, 1975–1984 and 1985–1994 (Ref.No. 2007F03-03a) |
June 2008 |
image (.gif)
print (.pdf)
data (.csv) |
 |
Silicosis: Age-adjusted death rates by county, U.S. residents age 15 and over, 1995–2004 (Ref.No. 2007F03-03b) |
June 2008 |
image (.gif)
print (.pdf)
data (.csv) |
 |
Silicosis: Counties with highest age-adjusted death rates (per million population), U.S. residents age 15 and over, 1995–2004 (Ref.No. 2007T03-10) |
June 2008 |
image (.gif)
print (.pdf)
data (.csv) |
 |
Silicosis: Estimated number of discharges from short-stay non-federal hospitals, 1970–2004 (Ref.No. 2007T03-11) |
June 2008 |
image (.gif)
print (.pdf)
data (.csv) |
 |
Silicosis: Number of cases by ascertainment source—Michigan, New Jersey, Ohio, 1993–2002 (Ref.No. 2007T03-12a) |
June 2008 |
image (.gif)
print (.pdf)
data (.csv) |
 |
Silicosis: Number of cases by ascertainment source—California, 2000–2002 (Ref.No. 2007T03-12b) |
June 2008 |
image (.gif)
print (.pdf)
data (.csv) |
 |
Silicosis: Number of cases by duration of occupational exposure to silica—Michigan, New Jersey, Ohio, 1993–2002 (Ref.No. 2007T03-13a) |
June 2008 |
image (.gif)
print (.pdf)
data (.csv) |
 |
Silicosis: Number of cases by duration of occupational exposure to silica—California, 2000–2002 (Ref.No. 2007T03-13b) |
June 2008 |
image (.gif)
print (.pdf)
data (.csv) |
 |
Silicosis: Decade of first exposure for 734 cases—Michigan, New Jersey, Ohio, 1993–2002 (Ref.No. 2007F03-05) |
June 2008 |
image (.gif)
print (.pdf)
data (.csv) |
 |
Silicosis: Primary industries associated with silica exposure of silicosis cases—Michigan, New Jersey, Ohio, 1993–2002 (Ref.No. 2007T03-14a) |
June 2008 |
image (.gif)
print (.pdf)
data (.csv) |
 |
Silicosis: Primary industries associated with silica exposure of silicosis cases—California, 2000–2002 (Ref.No. 2007T03-14b) |
June 2008 |
image (.gif)
print (.pdf)
data (.csv) |
 |
Silicosis: Primary occupations associated with silica exposure of silicosis cases—Michigan, New Jersey, Ohio, 1993–2002 (Ref.No. 2007T03-15a) |
June 2008 |
image (.gif)
print (.pdf)
data (.csv) |
 |
Silicosis: Primary occupations associated with silica exposure of silicosis cases—California, 2000–2002 (Ref.No. 2007T03-15b) |
June 2008 |
image (.gif)
print (.pdf)
data (.csv) |
 |
Respirable quartz: Geometric mean exposures in coal mining, MSHA inspector and mine operator samples, 1982–2003 (Ref.No. 2007F03-06a) |
June 2008 |
image (.gif)
print (.pdf)
data (.csv) |
 |
Respirable quartz: Geometric mean exposures by major industry division, MSHA and OSHA samples, 1979–2003 (Ref.No. 2007F03-06b) |
June 2008 |
image (.gif)
print (.pdf)
data (.csv) |
 |
Respirable quartz: Geometric mean exposures and percent exceeding designated occupational exposure limits in coal mining, MSHA inspector and mine operator samples, 1982–2003 (Ref.No. 2007T03-16a) |
June 2008 |
image (.gif)
print (.pdf)
data (.csv) |
 |
Respirable quartz: Geometric mean exposures and percent exceeding designated occupational exposure limits by major industry division, MSHA and OSHA samples, 1979–2003 (Ref.No. 2007T03-16b) |
June 2008 |
image (.gif)
print (.pdf)
data (.csv) |
 |
Respirable quartz: Number of samples, geometric mean exposures, and percent exceeding designated occupational exposure limits by industry, MSHA inspector and mine operator and OSHA samples, 1993–2003 (Ref.No. 2007T03-17) |
June 2008 |
image (.gif)
print (.pdf)
data (.csv) |
 |
Respirable quartz: Geometric mean exposures and percent exceeding designated occupational exposure limits by MSHA coal mine district and state, MSHA inspector and mine operator samples, 1982–2003 (Ref.No. 2007T03-18) |
June 2008 |
image (.gif)
print (.pdf)
data (.csv) |
 |
Respirable quartz: Geometric mean exposures and percent exceeding designated occupational exposure limits by MSHA metal/nonmetal mine district and state, MSHA samples, 1979–2003 (Ref.No. 2007T03-19) |
June 2008 |
image (.gif)
print (.pdf)
data (.csv) |
 |
Respirable quartz: Geometric mean exposures and percent exceeding designated occupational exposure limits by OSHA region and state, OSHA samples, 1979–2003 (Ref.No. 2007T03-20) |
June 2008 |
image (.gif)
print (.pdf)
data (.csv) |
 |
Respirable quartz: Geometric mean coal mining exposures by state, MSHA inspector and mine operator samples, 1982–2003 (Ref.No. 2007F03-07) |
June 2008 |
image (.gif)
print (.pdf)
data (.csv) |
 |
Respirable quartz: Geometric mean metal/nonmetal mining exposures by state, MSHA samples, 1979–2003 (Ref.No. 2007F03-08) |
June 2008 |
image (.gif)
print (.pdf)
data (.csv) |
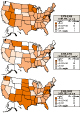 |
Respirable quartz: Geometric mean exposures by state, OSHA samples, 1979–2003 (Ref.No. 2007F03-09) |
June 2008 |
image (.gif)
print (.pdf)
data (.csv) |
 |
Respirable cristobalite: Geometric mean exposures and percent exceeding designated occupational exposure limits, MSHA and OSHA samples, 1979–2003 (Ref.No. 2007T03-21) |
June 2008 |
image (.gif)
print (.pdf)
data (.csv) |
| Return to WoRLD Table of Contents. |
| Download Adobe Reader to view .pdf files. |
Contact Information: |
Surveillance Branch
Division of Respiratory Disease Studies
NIOSH
1095 Willowdale Road
Morgantown, WV 26505
WoRLD@CDC.gov |
To receive email notification of updates to the Work-Related Lung Disease Surveillance System, email us at WoRLD@CDC.gov. In the subject line, type "WoRLD updates," and in the body of the email include all contact information. |
| |
| Feedback: |
Tell us what you think! In order to better serve the public and the scientific and educational communities, all comments and suggestions to improve this site are welcomed. WoRLD@CDC.gov.
Page last modified: June 23, 2008
Page last reviewed: June 23, 2008
Content Source: National Institute for Occupational Safety and Health (NIOSH)
|