| |
|||||||
|
|||||||
Article |
||
| Congressional Apportionment | ||
|
|
||
| The Census 2000 apportionment
population was 281,424,177, as shown in Table 1. The apportionment
population consists of the resident population of the 50 states plus
overseas federal employees (military and civilian) and their dependents
living with them, who were included in their home states. The population
of the District of Columbia is excluded from the apportionment population.
As required by the U.S. Supreme Court ruling (Department of Commerce
v. House of Representatives, 525 U.S. 316, 119 S. Ct. 765 (1999)),
the apportionment population counts do not reflect the use of statistical
sampling to adjust for overcounting or undercounting in the census.
This report, part of a series that analyzes population and housing data collected by Census 2000, examines trends in congressional apportionment and discusses the apportionment population — what it is, who is included, what method is used to calculate it, and so forth. |
||
| back
to top |
||
| Apportionment is a fundamental reason for the census. | ||
|
One of the fundamental reasons for conducting the decennial census of population is to reapportion the U.S. House of Representatives. Apportionment is the process of dividing the 435 memberships or seats in the U.S. House of Representatives among the 50 states. An apportionment has been made on the basis of each decennial census from 1790 to 2000, except following the 1920 census. |
||
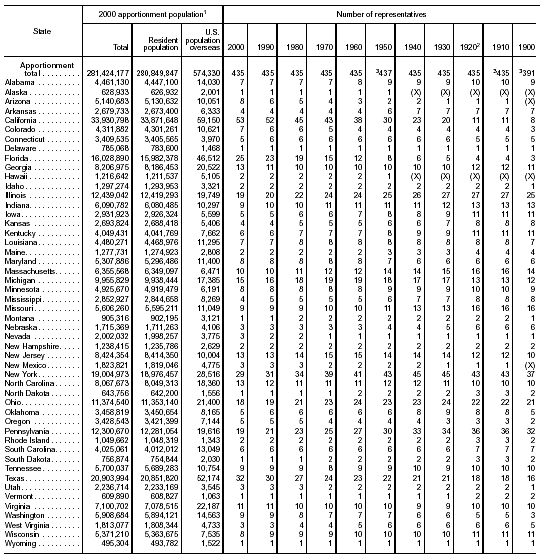 Table 1 - Apportionment population based on Census 2000 and apportionment of U.S. House of Representatives: 1900 to 2000 (X) Not applicable. 1Includes the resident population for the 50 states, as ascertained by Census 2000 under Title 13, U.S. Code, and counts of overseas U.S. military and federal civilian employees (and their dependents living with them) allocated to their home state, as reported by the employing federal agencies. The apportionment population does not include the resident or the overseas population of the District of Columbia. 2No reapportionment was made based on the 1920 census. 3Includes representatives assigned by Congress to newly admitted states after the apportionment act for that census: 1900, Oklahoma (five representatives); 1910, Arizona and New Mexico (one representative each); and 1950, Alaska and Hawaii (one representative each). Note: As required by the U.S. Supreme Court ruling ( Department of Commerce v. House of Representatives, 525 U.S. 316, 119 S. Ct. 765 (1999)), the Census 2000 apportionment population counts do not reflect the use of statistical sampling to adjust for overcounting or undercounting. Source: U.S. Census Bureau, Census 2000 and earlier censuses; and 1990 and earlier censuses also published in 1990 CPH-2-1, Population and Housing Unit Counts, United States, Table 3. |
||
| back
to top |
||
| The average size of a congressional district will rise. | ||
| The number of representatives
or seats in the U.S. House of Representatives has remained constant
at 435 since 1911, except for a temporary increase to 437 at the time
of admission of Alaska and Hawaii as states in 1959 (see Table 1).
However, the apportionment based on the 1960 census, which took effect
for the congressional election in 1962, reverted to 435 seats.
The average size of a congressional district based on the Census 2000 apportionment population will be 646,952, more than triple the average district size of 193,167 based on the 1900 census apportionment, and about 74,486 more than the average size based on the 1990 census (572,466). Of the seven states with one seat in Census 2000, the population of the largest — Montana — was 905,316, compared with an average size of congressional district in the other 43 states of 646,259. Wyoming, also with one seat in Census 2000, had the smallest district size, with 495,304. |
||
| back
to top |
||
| Twelve seats in the U.S. House of Representatives will shift from one state to another. | ||
| As a result of the
apportionment based on Census 2000, 12 seats in the U.S. House of
Representatives will shift among 18 states. Eight states will have
more representatives in the 108th Congress, which convenes in January
2003, and ten states will have fewer representatives (see Figure 1
and Table 2).
Of the eight states gaining seats, four — Arizona, Florida, Georgia, and Texas — will each gain two seats. The other four — California, Colorado, Nevada, and North Carolina — will each gain one seat. Of the ten states losing seats, two — New York and Pennsylvania — will each lose two seats. The other eight — Connecticut, Illinois, Indiana, Michigan, Mississippi, Ohio, Oklahoma, and Wisconsin — will each lose one seat. |
||
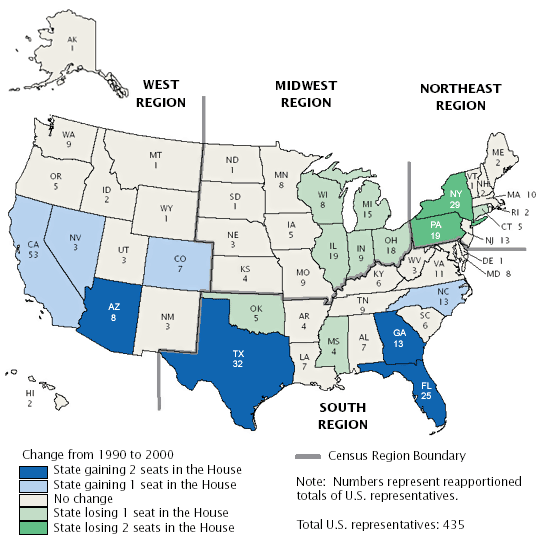 Figure 1 - Apportionment of the U.S. House of Representatives for the 108th Congress Source: U.S. Census Bureau, Census 2000 and earlier censuses; and 1990 and earlier censuses also published in 1990 CPH-2-1, Population and Housing Unit Counts, United States, Table 3. |
||
| back
to top |
||
| The 1990 census apportionment shifted 19 seats. | ||
| Following the 1990 census, reapportionment shifted 19 seats among 21 states (see Table 2). The largest gains were in California (seven seats), Florida (four seats), and Texas (three seats). Five states gained one seat each: Arizona, Georgia, North Carolina, Virginia, and Washington. | ||
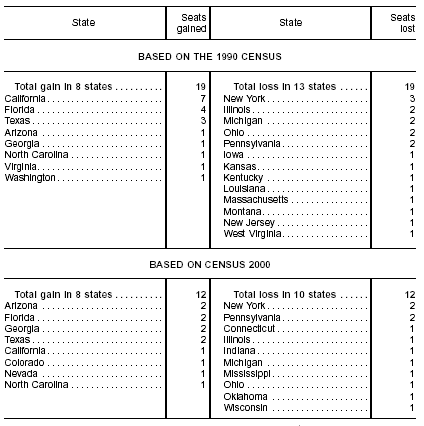 Table 2 - Change in the number of U.S. Representatives by State: 1990 and 2000 Source: U.S. Census Bureau, Census 2000 and earlier censuses; and 1990 and earlier censuses also published in 1990 CPH-2-1, Population and Housing Unit Counts, United States, Table 3. |
||
| The largest losses in seats after the 1990 census apportionment were in New York (three fewer seats); and in Illinois, Michigan, Ohio, and Pennsylvania (two fewer seats each). Eight states lost one seat each: Iowa, Kansas, Kentucky, Louisiana, Massachusetts, Montana, New Jersey, and West Virginia. | ||
| back
to top |
||
| Shifts in congressional representation reflect regional trends in population. | ||
| The regional patterns
of change in congressional representation between 1990 and 2000 reflect
the Nation's continuing shift in population from the Northeast
and Midwest to the South and West.
Based on the Census 2000 apportionment, the net increase of five seats in the South reflected a gain of seven seats in four states and a loss of two seats, one each in Mississippi and Oklahoma (see Table 3). The West gained five seats and lost none; the Northeast and Midwest each lost five seats and gained none. |
||
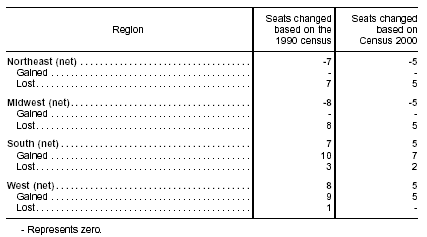 Table 3 - The change in the number of U.S. Representatives by region: 1990 and 2000 Source: U.S. Census Bureau, Census 2000 and earlier censuses; and 1990 and earlier censuses also published in 1990 CPH-2-1, Population and Housing Unit Counts, United States, Table 3. |
||
|
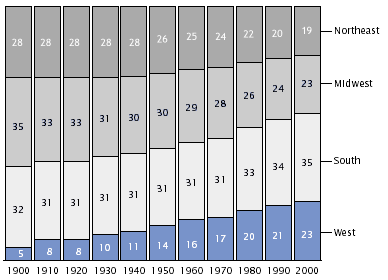
Based on the 1990 census apportionment, the net increase of seven seats in the South reflected a gain of ten seats in five states and a loss of three seats, one each in Kentucky, Louisiana, and West Virginia. The net increase of eight seats in the West reflected a gain of nine seats in three states and a loss of one seat in Montana. The Northeast lost seven seats and gained none; the Midwest lost eight seats and gained none. Figure 2 shows the percentage distribution of House seats or memberships by region for each census in the 20th century. The West gradually increased its share of House seats in each decade of the last century, so that its 23-percent share in 2000 was more than four times its 5-percent share in 1900.
Meanwhile, the Midwest, which accounted for the largest regional share of House seats from 1900 to 1920, showed a gradual decline in its share to 23 percent in 2000, the same as the West. After holding 28 percent of the House seats from 1900 to 1940, the Northeast saw a drop to 19 percent by 2000, the smallest share of House seats of any of the four regions. |
||
| back
to top |
||
| The Congress decides the method to calculate the apportionment. | ||
| Several apportionment
methods have been used since the first census in 1790. The apportionment
for Census 2000 was calculated using the method of equal proportions,
in accordance with the provisions of Title 2, U.S. Code. This method
has been used in every census since the 1940 census. First, each state
is assigned one congressional seat, as provided by the Constitution.
Then the apportionment formula allocates the remaining 385 congressional
seats one at a time among the 50 states until all 435 seats are assigned.
The goal of apportionment is to produce the most equitable distribution of congressional seats among the states. The method of equal proportions attains this by minimizing the percentage differences in the size of the congressional districts. |
||
| back
to top |
||
| Related Information | ||
|
||
|
||
| Adapted from Karen M Mills, U.S. Census Bureau, Congressional Apportionment, in Census 2000 Brief Series. | ||
| back
to top |