Daily Submission Statistics
| 2008 | Jan | Feb | Mar | Apr | May | June | July | Aug | Sep | Oct | Nov | Dec |
| 2007 | Jan | Feb | Mar | Apr | May | June | July | Aug | Sep | Oct | Nov | Dec |
| 2006 | Jan | Feb | Mar | Apr | May | Jun | Jul | Aug | Sep | Oct | Nov | Dec |
| 2005 | May | Jun | Jul | Aug | Sep | Oct | Nov | Dec |
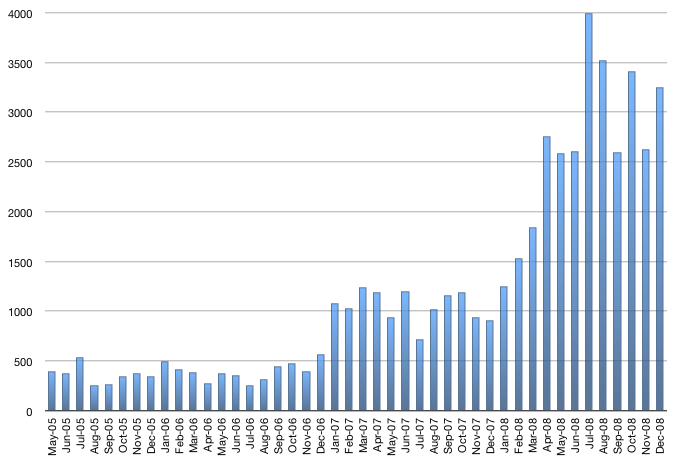
Monthly Aggregate Submission Statistics
This chart represents the number of manuscripts received by NIHMS and approved for processing by the author/PI for a given month.
Download the data used to create this chart in CSV format.