What is the Pacific Decadal Oscillation?
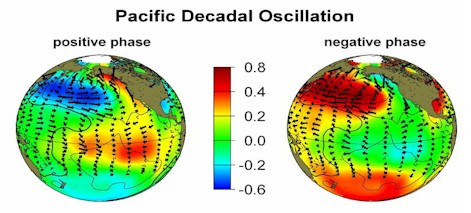 |
Color comparisons of warm versus cold phase PDO,
SST, Sea-level pressure,
and surface wind stress anomaly patterns
(Courtesy of University of Washington) |
Fisheries scientist Steven Hare created the term "Pacific Decadal Oscillation" (PDO) in 1996 to describe an
oscillation in northern Pacific sea surface temperatures (SSTs) that he noticed while researching
connections between Alaska salmon production cycles and Pacific climate. These oscillations between above normal
northern Pacific SSTs (negative phase) and below normal SSTs (positive phase) are represented in the graphic to the left.
PDO has been described as a long-lived El Niño/La Niña-like pattern of Pacific climate variability because
the two climate oscillations have similar relationships regarding deviations in SSTs. However, PDO operates at something
on the order of a 20- to 30-year time scale, while El Niño/La Niña events are typically on the order of 6
to 18 months in length. Both phenomonon correlate with relatively wetter or drier periods in the western
portion of North America. The interaction between the two climate cycles appears to play an important role in the climate
of Arizona, along with much of the western portions of North America.
How does PDO relate to El Niño/La Niña?
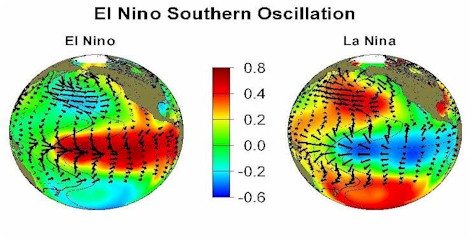 |
Color comparisons of warm versus cold phase El Nino/La Nina,
SST, Sea-level pressure,
and surface wind stress anomaly patterns
(Courtesy of University of Washington) |
The figure to the left illustrates the SSTs that occur during typical El Niño/La Niña events. Notice
that the pattern is similar to the PDO illustrated above, except that instead of the strongest signal being located in the
northern Pacific Ocean, as is the case with PDO, the strongest signals in El Niño/La Niña events tend to
be located near the equatorial regions of the Pacific.
This is the second difference between El Niño/La Niña events and PDO. Besides the difference in length
of time for each cycle, the effects on the SSTs are concentrated at different locations in the Pacific Ocean. Therefore,
the PDO is not a 20-year El Niño/La Niña event. As with most things related to climate, it is more
complicated than that. Basically, research has suggested that there is a fairly regular pattern of high and low pressure
systems over the northern portions of the Pacific Ocean, which are related to the SSTs in that region. The regularity of
either high pressure or low pressure off the coast of Alaska and Canada has a fundamental effect on the weather patterns
experienced by the west coast of North America.
What does this oscillation look like in the climate record?
 |
Time series of SST-based monthly PDO index
(Courtesy of University of Washington) |
Several independent studies find evidence for just two full PDO cycles in the past century. "Cool" PDO regimes
prevailed from 1890-1924 and again from 1947-1976, while "warm" PDO regimes dominated from 1925-1946 and from 1977 through
(at least) the mid 1990's. Some climatologists believe that another shift in the PDO cycle began around 1995.
How can Pacific Ocean SST's affect our day-to-day weather in Arizona?
The ocean plays a large role in the atmospheric circulation pattern which determines our weather and our climate.
Due to unequal heating of the equatorial regions versus the polar regions, temperature differences over land occur
which need to be removed by the atmosphere. These temperature differences are typically reduced in the atmophere
by the results of winds and through the generation of areas of low pressure which bring warm air northward toward
the poles and send cold air southward toward the equator. Additionally, differences between land and sea temperatures
can create changing weather conditions along and adjacent to coastlines. The same is true in the ocean, with
El Niño/Southern Oscillation and persistent ocean currents acting as mechanisms to relieve the continually
building and ebbing temperature gradients that are generated by uneven heating and cooling of the ocean.
The jetstream is a fast flowing ribbon of air in the atmosphere that tends to be the primary mechanism which determines
the weather pattern in a particular location. Cold air tends to be located to the north of the jetstream with relatively
warmer air located to the south of the jetstream. Thus, the jetstream tends to be located over areas where there is a
strong contrast in temperature, which in weather jargon is called a front. When the right conditions
exist, an area of low pressure can develop along the front, and act to relieve the temperature contrast. Low pressure
systems tend to develop underneath the
jetstream and propagate with it. A simple analogy to this would be to picture a leaf in a stream of water. The leaf
will flow with the stream and only go where the stream takes it. Low pressure acts like this as well. Low pressure systems
tend to be located with the jetstream, so in order to have stormy weather, you usually need to be near the jetstream.
Well, these temperature contrasts don't only exist over the land, but also exist in the oceans. In the normal situation
shown in the diagram above, warm water tends to be located over the western and central portions of the Pacific Ocean, with cooler
water located over the eastern sections. Thunderstorms develop primarily over the warm water, which
tends to be near Indonesia and the western portion of the Pacific Ocean. Energy from these thunderstorms acts to enhance
the jetstream and make it stronger. In this normal situation, this enhanced energy in the jetstream can generate areas of
low pressure along fronts which then travel eastward toward the west coast of the United States. These areas of low
pressure are what give us our rain and snowstorms in the winter.
 |
Typical atmospheric patterns associated with
El Nino and La Nina
(Courtesy of NOAA) |
During El Niño events, the warm pool of water, which typically is located over only the western portions of
the Pacific Ocean, spreads eastward toward South America. Eventually it covers the entire Pacific Ocean along the equator.
This results in an eastward movement of thunderstorm complexes, which in turn leads to the energy from these thunderstorms
impacting the jetstream closer to the western United States. As discussed above, the jetstream tends to be closely tied to
locations where there is a temperature contrast. In El Niño events, this temperature contrast usually is strongest
near the central and eastern portions of the Pacific ocean, which acts to keep the jetstream focused over this region.
As can be seen in the diagram to the left, this persistent jetstream which develops has a tendency to be focused over
the southern United
States and over Arizona. A large area of low pressure develops in the Gulf of Alaska which acts to supply
the jetstream with additional energy to generate additional strong storms. Since storms tend to develop with and
follow the jetstream, Arizona tends to get more storms, and thus, more precipitation under this particular pattern.
During La Niña events, colder than normal water exists over the central and eastern portions of the Pacific
Ocean. This reduces the temperature difference of the ocean in this region which makes the likelihood of a persistent
jetstream over the eastern portion of the Pacific Ocean less likely. As can be seen in the diagram, typically high pressure
builds over the Gulf of Alaska, which sends the jetstream well north into Alaska and then diving southward into the
Midwest of the United States. Occasionally, a portion of the jetstream will push through the ridge of high pressure to
impact the western United States, especially the northwest coast. This leaves Arizona well removed from the jetstream,
and thus leads to fewer storms, and less precipitation under this pattern.
Research conducted at the University of Washington's Climate Impacts Group suggests that PDO phases can combine with
El Niño/La Niña conditions in certain ways to affect precipitation in the West, particularly in the winter.
The positive phase of the PDO, with warm sea surface temperatures in the equatorial Pacific, can enhance an El Niño
episode, amplifying the effects of this warm pool of water on the western United States. This would lead to wetter
El Niño winters. This same phase of the PDO would weaken any La Niña episodes that would occur during
this time period. Similarly, during a negative phase of the PDO, La Niña events would be enhanced, and El Niño
events would be weakened. Therefore, you only get "true" El Niño/La Niña conditions when the PDO phase is
correct to enhance these events, otherwise they are weakened.
So what's this all mean?
What this suggests for the Southwest is that, when the PDO is in its positive phase, as it has been from 1977 to at
least 1995, we tend to experience wetter El Niño winters, but closer to normal precipitation during La Niña
winters. This combination of climatic conditions may improve water supplies because even though more rain may actually
fall in the summer, it is the winter precipitation that is typically responsible for most of the water replenishment in our
region.
If, however, as some climatologists believe, conditions have shifted to the negative phase of the PDO, we may
experience drier La Niña winters, and El Niño winters that are closer to our normal precipitation than the
excessive precipitation they typically provide. This would shift our long-term average precipitation downward, and give
us more opportunities for below normal precipitation winters than we have experienced in the 1977-1995 period. Thus, the
onset of a negative PDO phase could cause the Southwest to experience generally drier conditions over the next several
decades. It is uncertain how long or how dry conditions could get. Most of the region experienced a prolonged and severe
drought during the 1950s, in the midst of the last PDO negative phase.
The table below shows the yearly precipitation at Flagstaff since 1995. When totaled together, these numbers represent
a combined deficit of 35.71 inches of precipitation since 1995. Out of the past seven years, six have had below normal
precipitation. The only above normal precipitation year was 1998 which was an El Niño winter. As of October 22, the
deficit for 2002 was already 8.68 inches. When the current deficit for 2002 is added to the cumulative deficit since 1995,
the combined deficit becomes 44.39 inches. Our total yearly precipitation in Flagstaff is 22.91 inches (1971-2000 normals).
We are almost two years worth of precipitation behind normal.
| Year | Total Precipitation (Jan - Dec) |
Deviation |
| 1995 | 19.09" | -3.82" |
| 1996 | 11.81" | -11.10" |
| 1997 | 17.84" | -5.07" |
| 1998 | 27.35" | +4.46" |
| 1999 | 15.79" | -7.12" |
| 2000 | 15.40" | -7.51" |
| 2001 | 17.36" | -5.55" |
It is fairly easy to see that we are currently experiencing a long string of dry years. So far 2002 is shaping up
to be one of the driest. It has already gone down in the record books at Flagstaff as the driest winter
(Dec 21 - March 20) since
weather records began in 1898. It was one of the driest spring periods on record as well. Arizona
has a climate that sees many dry years with not as many wet years inbetween. A change to the PDO would make us experience
more dry years with fewer wet years in between. We still will have wet years, just not as many as normal. The PDO
doesn't make it a 100% guarantee that it will be wetter or drier than normal, but this cycle tends to tip the scales
in that direction. As we all know in northern Arizona, there is no 100% guarantee when it comes to weather!
How can I find out more about the Pacific Decadal Oscillation ?
Numerous webpages can be found on the internet with information about the PDO. The link provided below
is a good place to start if you are looking for more information regarding this ocean-atmospheric phenomenon.
|