
 |
PDF (863 KB) |
Every day, we learn what works so students can make greater progress. Six years after No Child Left Behind's passage – and mid-way to the nation's goal of having students on grade level or better in reading and math by 2014 – we have collected more data than ever before about the academic performance of our students and schools. This information enables all of us to chart where we are as individual states and as a nation and to map a course of action for future progress. The foundation of our success will depend on our continued commitment to the following core principles:
- High Standards
- Annual Assessments
- Accountability for Results
- Highly Qualified Teachers in Every Classroom (HQT)
- Information and Options for Parents
- All Children on Grade Level By 2014

Source: National Center for Education Statistics (NCES), Common Core of Data, 2004-05 School Year
Alabama Students
| Alabama | United States | |
|---|---|---|
| Total Students | 741,758 | 49,676,964 |
| Low-Income Students | 51.7% | 40.9% |
| Limited English Proficient | 2.2% | 8.5% |
| Students with Disabilities | 16.8% | 13.6% |
Source: National Center For Education Statistics (NCES), Common Core of Data, 2005-06 School Year
Alabama Schools
| Alabama | United States | |
|---|---|---|
| Number of Schools | 1,596 | 98,905 |
| Schools Making Adequate Yearly Progress | 1137 (83.7%) | 64,546 (70%) |
| Schools in Need of Improvement | 63 | 10,676 |
| Schools in Restructuring | 4 | 2,302 |
Source: Consolidated State Performance Report, 2006-07 & NCES CCD, 2005-06
Alabama Facts and Figures
Total NCLB Funding (2007): $313,138,149; a 52% increase over 2001 levels
Public AYP Release Date: August 2007
Testing System Status: Approved
Alabama Teachers
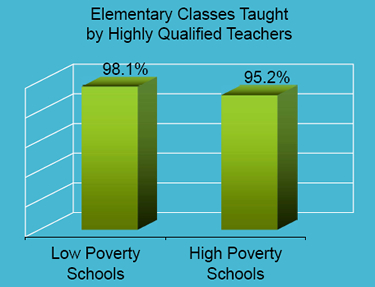
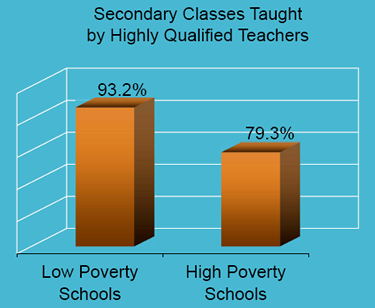
Source: Consolidated State Performance Reports, 2006-07
Alabama's Record of Achievement
| Alabama 4th Graders | |||
|---|---|---|---|
| State Data–% Proficient | NAEP Data–% Basic | NAEP Data–% Proficient | |
| All | 85% | 62% | 29% |
| White | 90% | 73% | 39% |
| Black | 76% | 43% | 13% |
| Hispanic | 73% | 45% | 17% |
| Low Income | 78% | 47% | 15% |
| Alabama 8th Graders | |||
|---|---|---|---|
| State Data–% Proficient | NAEP Data–% Basic | NAEP Data–% Proficient | |
| All | 72% | 62% | 21% |
| White | 80% | 73% | 29% |
| Black | 59% | 43% | 9% |
| Hispanic | 57% | 61% | 20% |
| Low Income | 61% | 50% | 11% |
| Alabama 4th Graders | |||
|---|---|---|---|
| State Data–% Proficient | NAEP Data–% Basic | NAEP Data–% Proficient | |
| All | 78% | 70% | 26% |
| White | 85% | 83% | 36% |
| Black | 67% | 50% | 10% |
| Hispanic | 69% | 55% | 17% |
| Low Income | 70% | 57% | 13% |
| Alabama 8th Graders | |||
|---|---|---|---|
| State Data–% Proficient | NAEP Data–% Basic | NAEP Data–% Proficient | |
| All | 66% | 55% | 18% |
| White | 75% | 70% | 27% |
| Black | 52% | 31% | 4% |
| Hispanic | 58% | 37% | 3% |
| Low Income | 54% | 37% | 6% |
Source: Alabama Testing Data and 2007 National Assessment of Educational Progress (NAEP) Data
Achievement Trends
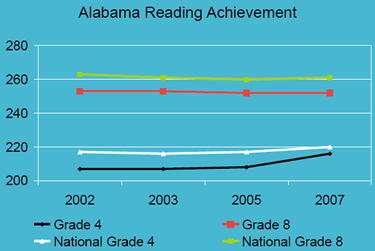
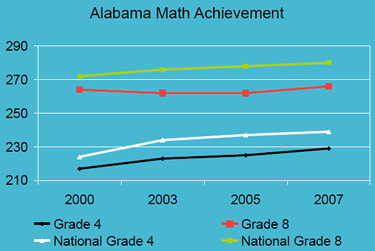
Source: National Assessment of Educational Progress (NAEP)
Preparing Alabama Students for Success
 The percentage
of high school students who graduate as reported by the state.
The percentage
of high school students who graduate as reported by the state.
Source: Consolidated State Performance Report, 2006-07
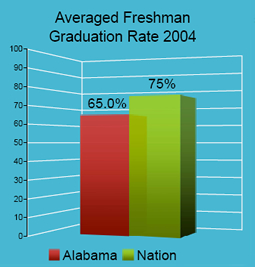 The Averaged Freshman Graduation Rate (AFGR) is a reliable definition for comparing across the states the percentage of students who graduate on time.
Source: National Center for Education Statistics (NCES)
High School Students Taking Advanced Placement Exams Source: College Board | |
| Alabama | Nation |
|---|---|
| 3,378 (10.2%) |
666,067 (24.2%) |
Options for Parents
| # of Eligible Alabama Students | % of Eligible Alabama Students Participating | % of Eligible Students Participating Nationally | |
|---|---|---|---|
| Tutoring | 55,166 | 2,031 (18.9%) | 529,627 (14.5%) |
| Choice | 18,980 | 2,543 (13.4%) | 119,988 (2.2%) |
Source: Consolidated State Performance Report, 2006-07
Flexibility Options for States - Alabama
| Teacher Incentive Fund | Not Participating |
| Limited English Proficient Partnership | Not Participating |
| Flexibility for Students with Disabilities | Participating |
| Tutoring Pilot | Not Participating |
| Growth Model | Not Participating |
| Districts in Need of Improvement Pilot | Not Participating |
|
|
|
|||||||||||
| |
||||||||||||
