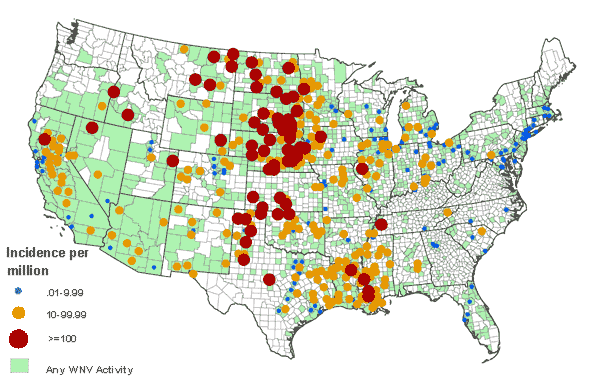
Final 2005 West Nile Virus
Human Neuroinvasive Disease
Incidence in the United States
This map reflects surveillance findings occurring January 1, 2005 through December 31, 2005 as reported to CDC's ArboNET system for public distribution by state and local health departments.

Human Neuroinvasive Disease
Incidence in the United States
This map reflects surveillance findings occurring January 1, 2005 through December 31, 2005 as reported to CDC's ArboNET system for public distribution by state and local health departments.

West Nile virus maps reflect surveillance reports released by state and local health departments to CDC's ArboNET system for public distribution. Map shows the distribution of human neuroinvasive disease (encephalitis and/or meningitis) incidence occurring during 2005 with number of human cases shaded according to incidences ranging from .01 to 9.99, 10 to 99.99, greater then 100, and WNV activity (human, mosquito, veterinary, avian and sentinel data).
Maps detailing county-level human, mosquito, veterinary, avian and sentinel data are published each week on the collaborative USGS/CDC West Nile virus web site: http://diseasemaps.usgs.gov/