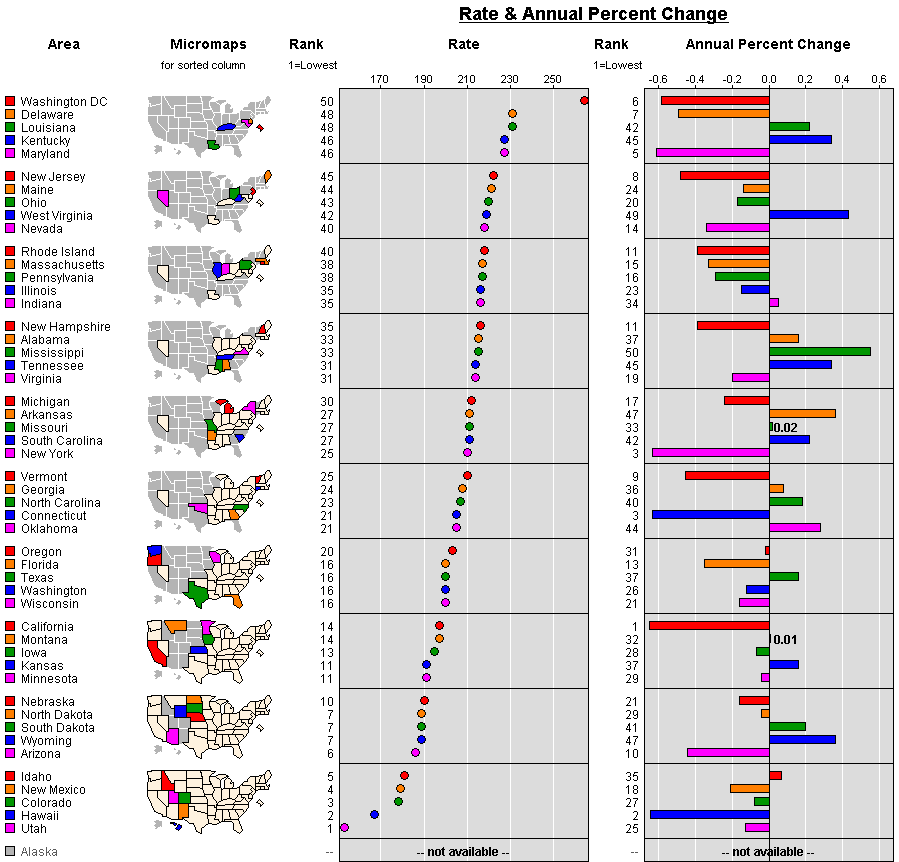
Linked Micromaps is a graphing program written in Java. It allows users to view
multiple variables interactively and compare statistics across regions (states, counties,
registries, hospitals) as well as across time. It supports six types of graph:
- bar graphs;
- box plots;
- raw data tables;
- point graphs;
- point graphs with arrow; and
- point graphs with confidence intervals.
In order to use Linked Micromaps, you must have Java installed on your PC. Your input files must be
in a delimited (such as Comma-Separated Values [CSV]) or fixed-width text format.
To learn more:
To ask questions about or get technical support for Linked Micromaps,
e-mail gistools@imsweb.com.
|