Analysis of Work Zone Gaps and Rear-End Collision Probability
DAZHI SUN 1,*
RAHIM
F. BENEKOHAL 2
ABSTRACT
This paper studies platooning and headway/gap characteristics of
traffic flow in highway short-term and long-term work zones under
various car-following patterns. The relationship between traffic
volume and the percentage of vehicles in platoons is developed,
along with some statistical models for platoon size and headway/gap
size distribution. An in-depth analysis of data reveals that
vehicles in work zones with higher speed limits maintain shorter
car-following time gaps than those in work zones with lower speed
limits, even though more time is needed to stop a faster vehicle.
This unusual combination of higher speeds and shorter car-following
time gaps in work zones may contribute to the high proportion of
rear-end collisions among all work zone-related accidents. This
paper also presents a new method for evaluating rear-end collision
potential, including the probability and the number of vehicles
involved in rear-end collisions, by analyzing platoon and gap
characteristics for locations without crash records during a
construction period.
KEYWORDS: Car-following patterns, rear-end collisions,
platoons, work zones.
INTRODUCTION
The number of fatalities in motor vehicle crashes in work zones
has risen from 693 in 1997 to 1,181 in 2002 in the United States.
Rear-end crashes are one of the most common kinds of work zone
crashes and account for more than 30% of all crashes in work zones.
By investigating gap characteristics of platooning vehicles in work
zones, researchers may be better able to evaluate the risk of
rear-end collisions for vehicles in platoons and understand driver
behavior in this situation.
In the past, numerous investigations have looked at the headway
characteristics of highway traffic, but limited studies exist on gap
characteristics, particularly in work zones. Wasielewski (1979)
reported on headway characteristics of highway traffic and concluded
that the headway distribution was independent of the traffic volume.
Luttinen (1992) studied the independence of consecutive headways
using geometric bunch size distribution for two-lane highways in
Finland. May (1990), Griffiths and Hunt (1991), Mei and Bullen
(1993), and Akcelik and Chung (1994) applied different models to
study the distribution of time headways in highway and urban traffic
flow conditions.
Most existing headway studies investigated normal traffic flow
conditions rather than work zone conditions. Work zone traffic flow
has different characteristics due to lower speed limits, work
activities, lane closures and channelization plans, and other
geometric and traffic factors. The presence of queues and platoons
of vehicles is more prevalent in work zones than on regular sections
of highway. Therefore, it is necessary to explore drivers'
car-following behaviors while they are traveling through
construction areas.
Benekohal and Sadeghhosseini (1991) and Sadeghhosseini and
Benekohal (1995) investigated the platooning and time headway
characteristics of highway work zones. They examined the effects of
traffic volume on distribution of time headways and on the
percentage of platooning vehicles. Although headway characteristics
have been used widely in these analyses, gap characteristics provide
a better measure of car-following behaviors and safety-related
issues. This paper focuses on quantifying the variations of time
headways or gaps for different car-following patterns and work zone
types and the relationship between car-following characteristics and
the accident risks/safety performances for work zones.
To address these issues, we analyzed field data from 11 work zone
sites. In the case study, we proposed and implemented a new
gap-analysis-based safety performance evaluation methodology for
work zones. Work zone safety performance is difficult to evaluate
due to the lack of reliable work zone crash data. This new method
provides an alternative approach to evaluating accident risk by
analyzing crash predisposition under nonaccident situations.
DATA COLLECTION AND REDUCTION
Field data were collected at 11 work zones sites on Interstate
highways in Illinois. Three of the sites investigated were
short-term work zones and eight were long-term. In this study, a
short-term work zone is defined as a construction or maintenance
site that lasted less than a few days and the closed lane was
delineated using cones, barrels, or barricades (but not barriers). A
long-term work zone is defined as a construction or maintenance site
that lasted more than a few days and the closed lane was delineated
using concrete barriers. The short-term work zones studied had a
posted speed limit of 45 mph, while all the long-term work zones had
a posted speed limit of 55 mph.
All 11 sites had two lanes in each direction; one lane was closed
due to construction and the other was open. A video camera was used
to capture the times at which a vehicle passed over two specific
markers placed at a fixed distance. The distance between the markers
was about 250 feet, but varied for different sites. Data were
collected over a time period of two to four hours for each site,
depending on the traffic conditions. Initially, the videotapes were
time coded. The time coding of the videotapes allowed us to read the
travel time more accurately. Time headway, time gap, space, speed,
and volume data were obtained from the tapes. The headway for each
vehicle was computed based on the time measured at marker 2 (the
marker closest to the camera) when the front bumper of a vehicle
passed over the line of sight between the camera and the marker. The
time headway for the following vehicle was the time difference
between the passing of the front bumper of the leading and following
vehicles over the line of sight. The gap is the time difference
between the passing of the rear bumper of the leading vehicle and
the front bumper of the following vehicle over the line of sight.
The time measurements are accurate to within 1/30 seconds.
Vehicles were classified into platooning or nonplatooning based
on their speed and spacing. A platoon is a group of vehicles
traveling close to one other with short headways. The literature
gives four definitions of platoons based on either time or space
headway, a combination of time headway and speed, or a combination
of space headway and speed. Different thresholds in time headway,
ranging from 2.5 to 6 seconds, have been used in the past to
identify platooning vehicles. Keller (1976) and Benekohal and
Sadeghhosseini (1991), for example, used five seconds as the
threshold of time headway to separate platooning vehicles from the
traffic flow. Sumner and Baguley (1978) used a gap of two seconds
and speed differences of less than 10% as the platooning threshold.
Horban (1983) suggested four seconds for the time headway threshold
in a level-of-service study. Our analysis focuses only on vehicles
in platoons and employs data on over 15,000 vehicles to investigate
platoon and gap characteristics in work zones.
PLATOONING AND GAP CHARACTERISTICS IN WORK ZONES
Analyses of platooning characteristics, including the percentage
of vehicles in platoons and platoon size distributions, are
discussed below. Then we analyze gap characteristics for platooning
vehicles to determine the effect of different car-following patterns
and work zone types on gap size, determine the effect of platoon
size on gap size, and establish a gap size distribution.
Platoon Analysis
Percentage of Platooning vs. Volume
Figure 1 shows how the percentage of vehicles in a platoon varies
as the traffic volume changes. Two different platooning criteria
were applied to examine the effect of the threshold, using
four-second and three-second headways.
We constructed 96 sets of data from the initial observation with
each corresponding to a 15-minute period of observation. The average
traffic volume and percentage of vehicles in the platoon were
computed for each set (plotted in figure 1). Figure
1A shows that the percentage of vehicles in the platoon varied
from 55% to 75% under low volume conditions (less than 600 vehicles
per hour (vph)). The percentage increased to 95% when traffic volume
reached about 1,200 vph.
Figure
1B uses a three-second headway as the platooning criteria, which
presents a lower percentage of platooning than the four-second
headway seen in figure 1A, yet there is still about 43% to 70%
platooning at low volume conditions. Only 80% of vehicles were
identified as platooning, with a volume of 1,400 vph using the
three-second headway criterion. As the volume rises, the percentage
increase in platooning slows, indicating that the three-second
criterion does not accurately reflect the reality of platooning.
Therefore, using a four-second headway as the platooning criterion
is more appropriate and provides a greater margin of safety than the
three-second headway. The methodology discussed in this paper is
independent of the headway threshold; only the numerical values
change. As a result, we define a platoon as a group of vehicles
separated by a time headway of no longer than four seconds. The
remaining discussion of platooning vehicles is based on this
definition.
We examined the relationship between traffic volume and
percentage of vehicles platooning and found that a logarithmic
function fit the data better than other forms. As volume increases,
the percentage of platooning vehicles increases and ultimately all
vehicles will be considered as part of a platoon. The logarithmic
function is expressed as
y = − 1.377 + 0.327
ln(x) (1)
where
x is the hourly flow rate (vph), 400 ≤ x ≤ 1400,
and
y is the percentage platooning (number of vehicles in a
platoon/volume).
Platoon Size Distribution
The type of vehicle leading a platoon and the number of vehicles
in each platoon were determined. Then platoons were classified into
two groups: truck-leading platoons and nontruck-leading platoons.
Truck-leading platoons have a large truck at the front of the
platoon. Platoons with the same number of vehicles were further
grouped into platoon size groups. The relative frequencies of the
platoon size groups are shown in figure
2A and figure
2B for short-term and long-term work zones, respectively. These
figures show that 70% to 80% of platoons had only two or three
vehicles.
Difference models were evaluated to see which of the observed
frequencies fit better. The goodness of fit was determined in terms
of the root mean square (RMS) error. As a result, a shifted negative
exponential function best fit the model in terms of having the least
RMS error. For short-term work zones, equations (2) and (3) describe
the relationship between platoon size (x) and the percentage
of vehicles belonging to that platoon size p(x).
Equation (2) represents truck-leading platoons, and equation (3)
represents nontruck-leading platoons.
 (2) (2)
 (3) (3)
Similar relationships were found for the long-term work zones as
expressed by equation (4) for truck-leading platoons and equation
(5) for nontruck leading platoons.
 (4) (4)
 (5) (5)
Table
1 shows the platoon size frequency, average headway, and average
gap for short-term and long-term work zones. The table shows that
more small platoons are led by cars. For example, the relative
frequency of nontruck-leading two-vehicle platoons is 0.55 for
short-term work zones and 0.52 for long-term work zones, while the
relative frequency of truck-leading two-vehicle platoons is only
0.45 for both short-term and long-term work zones.
To determine if the platoon size distributions of the four cases
shown in equations (2) through (5) differ significantly, the two
most commonly-used two-independent-samples tests—the Mann-Whitney U
test and the Kolmogorov-Smirnov z test in SPSS—were applied
for the following combinations:
- nontruck-leading platoon vs. truck-leading platoon in
short-term work zones,
- nontruck-leading platoon vs. truck-leading platoon in
long-term work zones,
- truck-leading platoon in short-term work zones vs. in
long-term work zones, and
- nontruck-leading platoon-in short-term work zones vs. in
long-term work zones.
The results of these tests show that the significance is less
than 0.05 for combinations 1 and 2; therefore, the hypothesis
H 0: the two distributions are identical is
rejected. For combinations 3 and 4, we cannot reject the null
hypothesis because the p-value is considerably above 0.05.
This indicates that the type of lead vehicle has a significant
impact on the platoon size distribution, while the type of work zone
does not.
Gap Analysis
To examine car-following safety in work zones, we analyzed the
time gap instead of the time headway, because the time gap
represents the actual time available for the following car to avoid
a rear-end collision. We also studied the effects of the combination
of the leader and follower on gap size as well as the effects of the
leader of a platoon on platoon size. We determined the gap size
distributions and used them to predict the probability of rear-end
collisions.
Effect of Car-Following Patterns
Will the gap size be affected by the combination of leader and
follower? For instance, a car following a truck may tend to keep a
larger time gap than a car following a car. Also, the probability of
a rear-end collision may depend on the brake features of the
following vehicle and the time gap available to it. To answer our
question, we studied the relationship between car-following patterns
and time gaps. We investigated the average gaps under different
car-following patterns. The four possible car-following patterns
analyzed are: car-car, car-truck, truck-car, truck-truck
(leader-follower).
Table
2A and 2B detail the mean gap, the mean headway, and the
frequency of four car-following patterns in short-term and long-term
work zones. These tables show that the average gap is the shortest
when a car follows another car. The next shortest gap is when a car
follows a truck. The gap is longer when a truck follows a car or a
truck. When a truck follows a car or a truck, the gap sizes are not
as different as when a car follows a car or a truck. This would
appear to indicate that car drivers are more sensitive to what type
of vehicles they are following than truck drivers. The table also
shows that the gaps in short-term work zones are longer than the
gaps in long-term work zones for the same combination of leader and
follower. Thus, it is important to know which one of these
differences is statistically significant.
This study presents only the aggregate analysis of the mean
headway/gap size for different car-following patterns. The data
appear to show that each vehicle's car-following behavior is
determined primarily by the vehicle directly in front of it,
particularly in highway work zones with only one lane open. Of
course, other vehicles may also impact driving behavior. The
interdependence of different car-following patterns is a complicated
problem that would benefit from a more extensive dataset and
disaggregate analysis on numerous combinations. Our current dataset
does not support this analysis, which we plan to address in a future
study.
A "two-sample means z-test" was conducted to evaluate the
difference between the mean time gap under different car-following
patterns. We compared the gaps in short-term and long-term work
zones for the same car-following pattern using a 95% confidence
level to test the hypotheses. The results of the tests of 16
different hypotheses are presented in table
3. The z-test shows no significant difference in the time
gap between truck-truck and car-truck following patterns in either
short-term or long-term work zones. This further supports our
findings in table 2. All the other null hypotheses were rejected
indicating that, with a 95% confidence level, there is a significant
difference in the time gap.
Safety Paradox
The analysis in the previous section shows significantly smaller
time gaps for all car-following patterns in long-term work zones
with a speed limit of 55 mph compared with gaps in short-term work
zones with a speed limit of 45 mph. Although the measured average
speeds in the two types of work zones that post the same speed limit
vary slightly, the average speeds of nonplatoon and platooning
vehicles in long-term work zones tend to be significantly higher
than those in short-term work zone. For example, the measured
average speed for a nonplatoon vehicle was 42.39 mph, with
platooning vehicles averaging 39.80 mph in short-term work zones. In
long-term work zones, the measured average speed was 53.29 mph for
nonplatoon vehicles, and 50.78 mph for platooning vehicles. Table 2
shows that for a car-car pattern, the average time gap for vehicles
with an average speed of 39.0 mph was 1.610 seconds, while the gap
for vehicles with an average speed of 50.78 mph was 1.384 seconds.
That is, the time gap decreased by 14% at an average speed increase
of 22%.
The above numbers indicate a safety paradox: even though people
know they need a greater safety buffer when they are driving at a
higher speed, our data show that the actual time gap they maintained
in a higher speed work zone was significantly shorter than that
maintained in a lower speed work zone. The problem may be that
people do not recognize this reduction in the safety buffer in terms
of the time gap. Rather, people may judge their safety buffer in
terms of the space gap. For example, for the car-car following
pattern, the average space gap in a long-term work zone (103 feet)
was still greater than that for a short-term work zone (94 feet),
but the real available time gap for the vehicle traveling in the
long-term work zone was reduced by 22%.
The Effect of Platoon Size
The number of vehicles involved in a rear-end collision depends
on the size of the platoon. The discussion here is limited to
platoons of seven vehicles or less, because we had only a few
observations for larger platoons. The variation in the time gap with
respect to platoon size is illustrated in figure
3.
Figure 3 shows that in short-term work zones, gap size generally
declines for truck-leading platoons as the platoon size increases,
except for the slight upturn as the platoon size increases from six
to seven. The declining trend also exists for truck-leading platoons
in long-term work zones, although the trend is not as clear as in
short-term work zones. For car-leading platoons, the average gap
size does not seem to depend on platoon size. For platoons
consisting of two or three vehicles, we found the average gap size
of truck-leading platoons was greater than that of car-leading
platoons in short-term and long-term work zones. For platoons with
four or more vehicles, the gap sizes of car-leading platoons were,
in general, greater than those of truck-leading platoons in
short-term work zones, whereas no significant difference was
observed for long-term work zones.
The above findings make it clear that as the platoon size of
truck-leading platoons increases, drivers tend to follow more
closely and thus become more vulnerable to a rear-end crash.
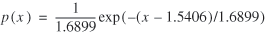
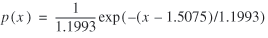
Gap Size Distribution
Gap size can better measure the probability of a rear-end crash
than headway. The observed mean gap size was 1.73 in short-term work
zones and 1.49 in long-term work zones. The median gap size was 1.68
and 1.42 for short-term and long-term work zones, respectively. In
order to find the gap size distribution, we grouped the observed
gaps into intervals of 0.25 seconds, starting from 0 seconds and
ending at 4 seconds. Figure
4 is a relative frequency histogram of gap sizes for short-term
and long-term work zones.
To find equations for the gap size distributions, the 10 widely
applied mathematical models were assessed using BestFit with respect
to RMS errors. Weibull offers the best fitted function followed by
the BetaGeneral function. Gamma, InvGauss, and log-normal ranked as
the third, fourth, and fifth best-fitted model, respectively. The appendix
presents a brief introduction to these five models to show the
density function as well as the model parameters.
The probability distribution function (PDF) of Weibull is
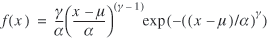
x ≥ μ;
γ, α >
0 (6)
where
γ is the shape parameter; γ = 2.396 for short-term
work zone and γ = 2.051 for long-term work zone;
μ is the location parameter; μ = 0.215 for
short-term work zone and μ = 0.286 for long-term work zone;
and
α is the scale parameter; α = 1.716 for short-term
work zone and α = 1.373 for long-term work zone.
The cumulative distribution function (CDF) of the three-parameter
Weibull is
 (7) (7)
For short-term work zones, the PDF and CDF of the resulting
Weibull models are
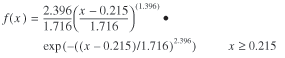 (8) (8)
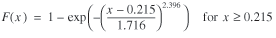 (9) (9)
For long-term work zones, the PDF and CDF of fitted Weibull
models are
 (10) (10)
 (11) (11)
ESTIMATION OF SAFETY PERFORMANCE USING GAP AND PLATOONING
ANALYSIS
Nearly one in three work zone crashes are rear-end crashes.
Rear-end crashes in a work zone can occur when a vehicle suddenly
decelerates due to an unexpected situation. The next section looks
at the probability of one or more collisions as a vehicle suddenly
decelerates.
Probability of at Least One Rear-End Collision
The risk of a rear-end collision is relative to the time gap,
platoon size, and position of the problem vehicle in a platoon. In
this section, we develop a model to compute the probability of
rear-end collisions when a platooning vehicle suddenly
decelerates.
The probability, (p) that a platooning vehicle has a less
than critical gap can be obtained via the gap relative frequency
histogram (figure 4) or the fitted Weibull CDF (equations (9) and
(11)) introduced above. For example, if the critical gap takes a
value of 1.0 seconds, we obtain a probability of 0.23 according to
equation (11).
Here, we define a rear-end collision as the collision of a
following vehicle with the leading vehicle due to an unsafe gap,
when the leading vehicle suddenly decelerates. There are at most
(i – 1) rear-end collisions as the first vehicle in a platoon
of size i makes a sudden deceleration.
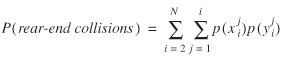
Figure
5 shows our calculation of the probability of at least one
rear-end collision as the jth vehicle of a platoon of
i vehicles suddenly decelerates or stops. For a platoon of
j + 1 vehicles, the probability of having a rear-end
collision is p; and the probability of no rear-end collision
is 1 – p. For a platoon of j + 2 vehicles, the
probability of one rear-end collision is 2 × p (1 −
p); the probability of two rear-end collisions is p
2; and the probability of no rear-end collisions is 1 −
p 2 − 2p (1 − p). For a platoon of
j + 3 vehicles, the probability of one rear-end collision is
C31 × p (1 −
p)2 = 3p (1 − p)2; the
probability of two rear-end collisions is
C32 p 2 (1 −
p)2 = 3p 2 (1 − p); the
probability of three rear-end collisions is
C33 p 3; and the
probability of no rear-end collisions is 1 − 3p (1 −
p)2 − 3p 2 (1 − p) −
p 3.
As such, for a platoon of i (where i ≥ j)
vehicles, the probability of a rear-end collision is

Thus, we are able to generalize the equation for calculating the
rear-end collision probability when the problem vehicle is the
jth vehicle in a platoon of size i as
 (12) (12)
The probability of no rear-end collision is
 (13) (13)
where
 is the probability that at least one rear-end
collision occurs as the jth vehicle of a platoon of size
i makes a sudden deceleration. is the probability that at least one rear-end
collision occurs as the jth vehicle of a platoon of size
i makes a sudden deceleration.
 is the probability that no rear-end collision occurs
as the jth vehicle of a platoon of size i makes a
sudden deceleration. is the probability that no rear-end collision occurs
as the jth vehicle of a platoon of size i makes a
sudden deceleration.
p is the probability that a vehicle has a gap less than
the critical gap value (probability of having a rear-end
collision);
j is the position of the problem vehicle in the
platoon;
i is the platoon size;
m is the number of rear-end collisions that take place;
and
N is the vector of all possible platoon sizes
[2,3,4...].
When a nonplatooning vehicle keeps a headway of at least four
seconds, the probability of rear-end collisions due to the sudden
deceleration of a nonplatooning vehicle is considered to be zero
(p (y1) = 0).
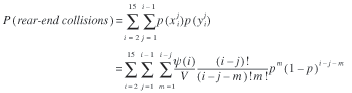
Probability that the jth Vehicle in a Platoon is a
Problem Vehicle
The number of vehicles involved in a rear-end collision is
relative to the platoon size and the position of the problem vehicle
in the platoon. For example, if the leading car in a longer platoon
is involved in an accident, the probability of a multivehicle
rear-end collision is higher than that when any other vehicle in the
platoon is involved.
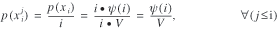
Equation (14) gives the probability that a problem vehicle is in
a platoon of size i:
 (14) (14)
where
p (x i) is the probability that the
problem vehicle belongs to a platoon of size i;
ψ (i) is the number of platoons of size i,
which is obtained from figures 1 and 2 for a given volume; and
V is the traffic volume.
The problem vehicle has an equal chance of being at any position
within a given platoon. Thus, equation (15) was constructed to
represent the probability that the problem vehicle is the jth
vehicle in a platoon of size i:
 (15) (15)
Finally, equation (16) was developed to calculate the probability
of having rear-end collision(s) when any vehicle in a traffic flow
makes a sudden deceleration:
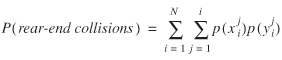 (16) (16)
As the probability of a rear-end collision caused by the sudden
deceleration of a nonplatooning vehicle is considered to be zero
(p (y1) = 0), equation (16) can be
modified:
 (17) (17)
where
p(rear-end collisions) is the probability of one or
more rear-end collisions as a problem vehicle suddenly
decelerates;
 is the probability that the jth vehicle in a
platton of size i is a problem vehicle, which is given by
equation (15); is the probability that the jth vehicle in a
platton of size i is a problem vehicle, which is given by
equation (15);
 is the probability of rear-end collisions when the
jth vehicle in a platton of size i suddenly
decelerates, which is given by equation (12). is the probability of rear-end collisions when the
jth vehicle in a platton of size i suddenly
decelerates, which is given by equation (12).
Number of Vehicles in Rear-End Collisions
In order to predict the number of vehicles involved in rear-end
collisions caused by the sudden deceleration of a problem vehicle in
a work zone, it is necessary to know the mean number of vehicles
(κi) involved in rear-end collisions for each
platoon size i. We also need to know the probability
(pi) that the problem vehicle belongs to a platoon
of size i. The mean number of vehicles in rear-end collisions
can be computed by  . .
Finding κi
For a particular platoon (i ∈ N), the number of
vehicles involved in rear-end collisions depends on the position of
the problem vehicle and platoon size. All vehicles in the platoon
have an equal chance of being the problem vehicle, but each has a
different number of following vehicles.
The number of vehicles involved in rear-end collisions also
depends on the type of collision. If m rear-end collisions
are continuous, there will be m + 1 vehicles involved. On the
other hand, if these rear-end collisions are discrete, there will be
at most 2m vehicles involved. To make a comprehensive
prediction, we used the average value (m + 1 + 2m)/2
as the number of vehicles involved in m rear-end
collisions.
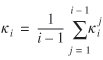
We defined κ ji as the mean size of
the rear-end collision if the problem vehicle is the jth
vehicle in a platoon with i vehicles. Assuming that the
problem vehicle is the first vehicle in a platoon, the following
examples demonstrate how to find
κ1i.
A platoon of two vehicles involves only one possible rear-end
collision, thus κ 12 = 2.
For a platoon of three vehicles, the probability of a rear-end
collision is 2 × p(1 − p); a probability of having two
rear-end collisions is p2; thus
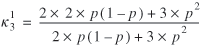
Likewise, for a platoon of four vehicles, the probability of
having a rear-end collision is
C31 × p(1 −
p)2 = 3p(1 − p)2;
the probability of having two rear-end collisions is
C32 p2 (1 −
p)2 = 3 p2 (1 − p);
the probability of having three rear-end collisions is
C33 = p3;
thus
 . .
We estimate the equation for
κ1i as follows:
 (18) (18)
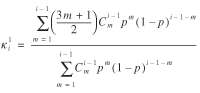
Similarly, the general formula for the mean number of vehicles in
the rear-end collision when the jth vehicle is the problem
vehicle in a platoon of size i is
 (19) (19)
Now, we can compute κ i from the following
equation:
 (20) (20)
Therefore, the mean number of vehicles involved in a crash caused
by sudden deceleration can be obtained from
 (21) (21)
The pi can be calculated easily using the
percentage of platooning and the platoon size distribution.
CASE STUDY
Our case study attempts to predict the probability of rear-end
collisions and the mean number of vehicles involved at a long-term
work zone. We developed equations to make the prediction using two
input variables. The input variables are: 1) work zone type
(long-term or short-term), and 2) hourly volume.
Assume that there is a sudden deceleration in a work zone traffic
flow, the proposed methodology presented here can be used to answer
the following questions:
- What is the probability of a rear-end crash?
- How many vehicles might be involved in this crash?
The prediction uses equations (1), (5), (11), (17), and (21) to
answer the above questions. Predictions are for a long-term work
zone with volumes of 400 to 1,600 vehicles per hour at increments of
200.
Solution to Question 1
Assume the maximum platoon size is 15 vehicles.
In a long-term work zone, with the assumption of a critical gap
of 1.0 seconds, equation (11) gives us a p of 0.23. This is
the conditional probability of having a rear-end collision given a
sudden stop or deceleration of a platoon vehicle due to an incident,
error maneuver, or some other unexpected reason. This probability
may seem high; however, this rear-end collision probability is
defined differently from the frequency of rear-end collisions in
accident statistics. To get a real overall probability or frequency
of real rear-end collisions on a given highway, this probability
must be multiplied by the sum probability of all other types of
accidents involving only a single vehicle at this location.
Using equations (1) and (7), and the average platoon size
μ as 3.2, we can compute ψ(i) from
![lowercase psi (lowercase i) = uppercase v divided by lowercase mu dot [negative 1.377 plus 0.327 ln (uppercase v)] dot {1 divided by 1.4079 exp [negative (lowercase x minus 1.4856) divided by 1.4079]}](https://webarchive.library.unt.edu/eot2008/20090115175443im_/https://www.bts.gov/publications/journal_of_transportation_and_statistics/volume_08_number_02/images/Sun_Benekohal-109.gif)
Now we can compute the conditional probability of rear-end
collisions if one vehicle suddenly stops or decelerates. Figure
6A shows that the mean probability of a rear-end collision in a
long-term work zone is 18.74% if a vehicle suddenly decelerates or
stops. The results also show that the risk of rear-end collisions
increases as the volume increases.
Solution to Question 2
We also calculated the mean number of vehicles involved in
rear-end collision(s) for different platoon sizes:

Figure
6B shows that the mean number of vehicles, κi,
will increase from 2.0 to 3.6 when the platoon size grows from 2 up
to 15. The figure also shows that the mean number of vehicles
involved for overall traffic will increase from 2.0 to 2.1 as the
maximum platoon size of a traffic flow grows from 2 to 15.
Obviously, the change in κ is not significant while the
maximum platoon size changes significantly, even though the possible
mean number of involved vehicles, κi, for a
platoon size of 15 is about 1.8 times that for a platoon size of 2.
This implies that using only the mean value may be misleading when
we want to understand safety performance in work zones, because the
change in the maximum platoon size will make a significant
difference in the consequence of the worst case.
CONCLUSIONS AND RECOMMENDATIONS FOR FUTURE RESEARCH
This paper presents an investigation of the platooning and gap
characteristics in Interstate highway work zones, as well as of the
gap sizes under different car-following patterns and work zone
types. The study is based on data covering more than 15,000
observations. Models of the platoon size and gap size distribution
for long-term and short-term work zones were developed. An in-depth
analysis of the data reveals a safety paradox, which may indicate
that drivers do not understand the safety implications of time and
space gaps relative to speed limit increases at work zones. All the
findings with respect to car-following characteristics provide
practitioners a better understanding of drivers' behaviors in work
zone areas.
We propose a new methodology to predict the probability of
rear-end collisions in a work zone and the mean number of vehicles
involved. Only two simple inputs are required to predict rear-end
collisions using gap and platooning models. Because it is sometimes
impossible to evaluate work zone safety performance using real crash
data, this new methodology provides an alternative approach to
assessing the safety performance in Interstate highway work zones.
We present a case study to demonstrate the implementation of the new
prediction methodology.
Some areas for future research include integrating the effect of
heavy vehicle and work activity intensity on safety as an
interesting extension to our methodology. It will also be important
to conduct some disaggregate analysis to address the interdependence
of different car-following patterns. A study of this nature may need
to consider the impact of various groups of drivers, such as age
group, gender, driving habits, etc., which may require more
extensive data collection.
ACKNOWLEDGMENTS
The authors would like to thank the anonymous referees for their
helpful comments during the development stage of this paper.
REFERENCES
Akcelik, R. and E. Chung. 1994. Calibration of the
Bunched Exponential Distribution of Arrival Headways. Road and
Transport Research (Australian Road Research Board)
3(1):43–59.
Benekohal, R.F. and S. Sadeghhosseini. 1991.
Platooning Characteristics of Vehicles in Highway Construction
Zones. Modeling and Simulation 22:16–23.
Griffiths, J.D. and J.G. Hunt. 1991. Vehicle Headways
in Urban Areas. Traffic Engineering and Control
32(10):458–462.
Hoban, C.J. 1983. Toward a Review of the Concept of
Level of Service for Two-Lane Rural Roads. Australian Road
Research, September, pp. 216–218.
Keller, H. 1976. Effects of a General Speed Limit on
Platoons of Vehicles. Traffic Engineering and Control, July,
pp. 300–303.
Luttinen, R.T. 1992. Statistical Properties of Vehicle
Time Headways. Transportation Research Record 365:92–98.
May, A.D. 1990. Traffic Flow Fundamentals.
Englewood Cliffs, NJ: Prentice Hall.
Mei, M. and A.G.R. Bullen. 1993. The Log-Normal
Distribution for High Traffic Flow. Transportation Research
Record 1398:125–128.
Sadeghhosseini, S. and R.F. Benekohal. 1995. Space
Headway and Safety of Platooning Highway Traffic, Traffic Congestion
and Traffic Safety in the 21st Century, Chicago, Illinois, pp.
472-478.
Sumner, R. and C. Baguley. 1978. Close Following
Behavior at Two Sites on Rural Two Lane Motorways, TRRL Report
859. Crowthorne, UK: Transport and Road Research Laboratory.
Wasielewski, P. 1979. Car-Following Headways on
Freeways Interpreted by the Semi-Poisson Headway Distribution Model.
Transportation Science 13(1):36–55.
ADDRESSES FOR CORRESPONDENCE
Corresponding author: D. Sun, Texas
Transportation Institute, Texas A&M University System, 1100 NW
Loop 410, Suite 400, San Antonio, TX 78213. E-mail: d-sun@tamu.edu
R.F. Benekohal, Newmark Civil
Engineering Laboratory, Department of Civil and Environmental
Engineering, University of Illinois at Urbana-Champaign, Urbana, IL
6180. E-mail: rbenekoh@uiuc.edu
|