


| Market Description |
-
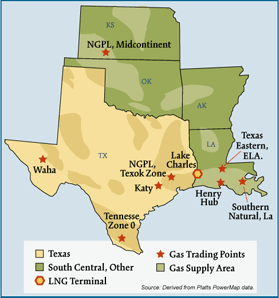
The South Central is the key natural gas producing region in the United States. In 2005, it accounted for about 57 percent of total estimated dry natural gas production and nearly 50 percent of proved dry natural gas reserves. The region is home to almost 2 Tcf of storage capacity and innumerable interstate and intrastate pipeline interconnections and natural gas market centers and hubs such as the Henry, Katy, Moss Bluff and Waha Hubs. In 2005, regional gas consumption exceeded one-quarter of lower-48 natural gas production and represented one-third of lower-48 natural gas consumed by the electric power sector.
| Geography |
-
States covered: Arkansas, Kansas, Louisiana, Oklahoma, and Texas.
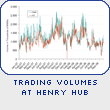
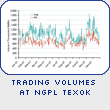
| Major Trading Hubs |
-
Henry Hub, Egan Hub, Waha Hub, Katy Hub, Houston Ship Channel, Moss Bluff Hub, Carthage Hub, NGPL TexOK, NGPL South Texas, and Southern Natural (Louisiana).
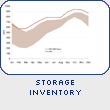
| Storage |
-
State Demand: Louisiana and Texas account for 65 percent of total South Central storage capacity. Over one-third of the storage facilities in the region are salt cavern facilities and represent almost 40 percent of regional storage deliverability. Storage facilities are well inter-connected to both intra-state and interstate pipelines. South Central storage enables customers in market areas (e.g., the Southeast, Mid-Atlantic and Northeast regions) to balance their daily needs and draw upon additional supplies on peak days.
- Henry Hub: 15 Bcf
- Egan Hub: 14 Bcf
- Perryville: 97 Bcf
- Katy Storage: 21 Bcf
- Moss Bluff: 12 Bcf
Depleted Field Capacity: 92%
Salt Cavern Capacity: 8%
Total Capacity: South Central has 23 percent of total U.S. storage capacity.
Major Storage Locations and Capacity:
Louisiana
| Demand |
-
2005
- Residential: 6%
- Commercial: 5%
- Industrial: 44%
- Electric Utility: 34%
Sector:
State: Louisiana and Texas account for 83 percent of total South Central demand. Those two states account for 22 percent of average annual U.S. demand.
Midwest Total: 5.6 Tcf annually (16.4 Bcfd), which accounts for 26 percent of total U.S. daily demand.
Residential Consumer Total: 7.2 million which is approximately 11 percent of total residential consumers in the US.
Key Consuming States: Texas alone accounts for 55 percent of the total number of consumers in the South Central and about 6 percent of the total number of consumers in the U.S.
Residential Consumers: Account for 92 percent of total regional consumers but only 7 percent of overall demand, while the industrial sector accounts for 49 percent of overall demand.
| Production |
-
State: Due mainly to increased production from the Barnett Shale near Ft. Worth and basins in East Texas, the states of Texas, Oklahoma and Louisiana now account for 94 percent of South Central production. This compares to 93 percent in 2005.
Total: South Central remains the major production region in the United States and accounts for 46% of total U.S. production.
| Pipeline Flows |
-
Average Daily Supply: The South Central region is a net exporter of natural gas mainly to downstream markets in the Midwest, Southeast, Mid-Atlantic and Northeast.
Major Pipelines: Texas Eastern Transmission, Tennessee Gas Pipeline, Southern Natural Gas, Transcontinental Gas Pipe Line, Gulf South Pipeline, CenterPoint Energy Gas Transmission, Natural Gas Pipeline Company of America, Trunkline Gas Company, Columbia Gulf Transmission Company, Texas Gas Transmission, and Florida Gas Transmission.
| Imports and Exports |
-
International gas imports and exports still play a minor role in the South Central market when compared to regional domestic gas production. Pipeline imports from Mexico are negligible; exports to Mexico averaged about 800 MMMcfd in 2006. LNG is poised to reflect a growing share of regional supplies. The Lake Charles and Excelerate Energy Bridge LNG facilities complement domestic regional gas supplies. Although Lake Charles accounted for a growing share of U.S. LNG imports in 2006 average utilization at the terminal remains low and imports depend mainly on U.S. supply and demand market dynamics versus gas requirements, pricing, and logistics in competing markets.
Imports at Lake Charles LNG Plant:
2004: 0.5 Bcfd
2005: 0.3 Bcfd
2006: 0.4 Bcfd
Imports from Mexico into the U.S.: Flows are negligible averaging 0.01 Bcfd thus far in 2006.
Exports from US into Mexico:
2005: 0.7 Bcfd
2006: 0.8 Bcfd
Major Exporter: El Paso natural gas accounts for the majority of gas flows into Mexico. It flows:
2005: 0.5 Bcfd
2006: 0.6 Bcfd