


| Geography |
-
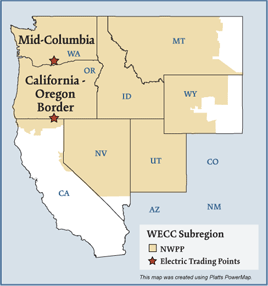
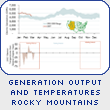
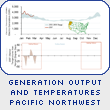
States covered: All or most of Washington, Oregon, Idaho, Utah, Nevada, Montana, Wyoming and part of California.
Reliability region: Northwest Power Pool Area (NWPP) sub-region [WECC subregions map
Balancing authorities: List
Hubs: California-Oregon Border (COB), Mid-Columbia (Mid-C)
| RTO/ISO |
-
None
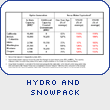
| Generation/Supply |
-
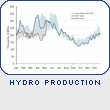
Marginal fuel type: Hydro and natural gas
Generating capacity (winter 2005): 57,120 MW
Capacity reserve (winter 2005): 16,822 MW
Reserve margin (winter 2005): 42%
When taken together, hydro, fossil fuels, nuclear energy, and renewable resources, were adequate to provide electricity in excess of in-region needs.
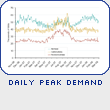
| Demand |
-
All time peak demand (2005): 40,298 MW
Peak demand growth: 1.5% (2005–2004)
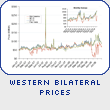
| Prices |
-
Index
Annual Average of Daily Bilateral Day Ahead On-Peak Prices
Platts “California-Oregon Border (COB) Hub”
2004: $49.02/MWh
2005: $66.95/MWh
2006: $55.58/MWh
2007: $62.14/MWh
Platts “Mid-Columbia (Mid-C) Hub”:
2004: $44.50/MWh
2005: $62.95/MWh
2006: $50.18/MWh
2007: $56.57/MWh
Physical and financial electricity products are traded through brokers using the Mid-Columbia (Mid-C) and California-Oregon Border (COB) hubs as pricing points.
| Interconnections/Seams |
-
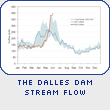
The region relies on hydroelectric production for approximately two thirds of its electricity needs. In most years, Northwest sells surplus power into California and the Southwest.