


| Geography |
-
States covered: California (most of) and northern Baja California (Mexico)
Reliability region: California-Mexico Power Area (CAMX) sub-region [WECC subregions map
Balancing authorities: California ISO (CAISO), Sacramento Municipal Utility District (SMUD), Turlock Irrigation District (TID), Los Angeles Department of Water and Power (LADWP), and Comision Federal de Electricidad (CFE). [WECC balancing authority map
Approximately 80% of demand in the CAMX subregion is within the area of the CAISO balancing authority. The portion of the CAMX area within Mexico is comparatively small. The remaining 20% of California's load is managed primarily by municipal utilities and irrigation districts such as the Los Angeles Department of Water and Power, the Sacramento Municipal Utility District, and the Imperial Irrigation District.
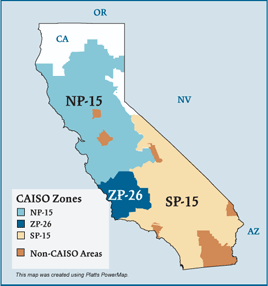
CAISO zones: NP-15, ZP-26, SP-15
| RTO/ISO |
- Real-time imbalance energy,
- Ancillary services, and
- Transmission usage.
Market Monitor: Keith Casey – Director, Department of Market Monitoring
| Generation/Supply (CAISO only) |
-
Marginal fuel type: natural gas
Generating capacity (summer 2006): 56,347 MW
Capacity reserve (summer 2006): 6,077 MW
Reserve margin (summer 2006): 12%
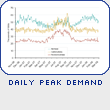
| Demand (CAISO only) |
-
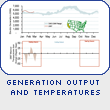
All time peak demand: 50,270 MW (set July 24, 2006)
In July 2006, CAISO experienced an extreme heat wave that resulted in new records for peak loads and for temperatures across the state.
Peak demand growth: 10.7% (2006-2005)
| 2004 | 2005 | 2006 | |
|---|---|---|---|
| Summer Peak Demand (MW) | 45,597 | 45,431 | 50,270 |
| Source: Derived from CAISO data | |||
Load pockets: Humbolt, North Bay, Greater San Francisco Bay, Sierra, Stockton, Los Angeles Basin, and San Diego areas.
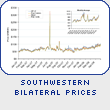
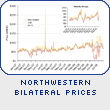
| Prices (CAISO only) |
-
Annual Average Price (ISO Real-time)
NP-15:
2004: $38.35/MWh
2005: $54.39/MWh
2006: $43.38/MWh
2007: $54.44/MWh
SP-15:
2004: $39.64/MWh
2005: $55.52/MWh
2006: $46.84/MWh
2007: $54.45/MWh
| Interconnections/Seams |
- Load serving entities within CAISO rely on imports for approximately one-fourth of their annual energy needs.