|
|
|
|
|
|
| Airline Domestic Market Share October 2007 - September 2008 |
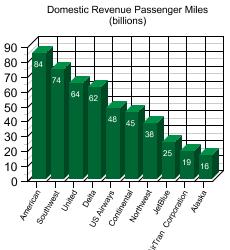
| Airlines | Share | | American | 14.5% | | Southwest | 12.7% | | United | 11.1% | | Delta | 10.6% | | US Airways | 8.2% | | Continental | 7.7% | | Northwest | 6.5% | | JetBlue | 4.2% | | AirTran Corporation | 3.2% | | Alaska | 2.8% | | Other | 18.5% | | Market share based on Revenue Passenger Miles October 2007 - September 2008. |
| Top Domestic Routes October 2007 - September 2008 |

| | Based on enplaned passengers of all airports for a city pair October 2007 - September 2008. |
| | At a Glance |
Click a bar for details. Mouseover it for percentage. | | Border Crossing more... |
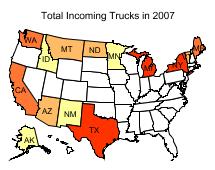
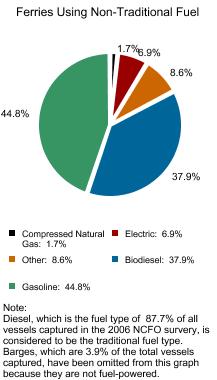
Click a state for details. Mouseover it for state total. | | National Census of Ferry Operators | | (NCFO) more... |
|
|
|
|
|
|
|