skip to content program navigation
| Learn more about these WEATHER RESEARCH areas... |
Weather Observing Systems
Observations are the bedrock of weather forecasting. The nation’s Founding Fathers, Thomas Jefferson and George Washington, kept journals filled with daily weather observations. They, along with other farmers, knew the importance of keeping track of the weather and recording it. Their daily notations give us a wonderful record of what the weather was like during that period. According to a history of the Weather Service, during the 19th Century many people realized the necessity of amassing a record of regular weather observations and efforts to develop a coordinated system began in 1814. These attempts throughout the 19th Century culminated in the development of a weather observation network under the Army Signal Corps in 1870.
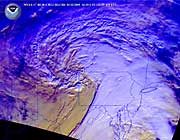
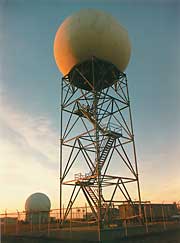
Satellites and Radar
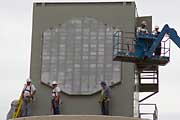
Today, NOAA operates a network of satellites that provide us with space-based observations of the atmosphere. At the same time, NOAA research labs work to develop other new tools and systems. In Norman, OK, for example, the National Severe Storms Laboratory (NSSL), recognized the potential of Doppler radar to improve the detection and warning of severe weather. After years of research and experimentation, NSSL demonstrated that Doppler radar could provide improved severe thunderstorm and tornado warnings. This technology was transferred to the National Weather Service where a new generation of Doppler radars called NEXRAD was developed for the Nation. The operational network of radars, which you might hear mentioned on your nightly television weather each night, provides information on the speed, intensity and movement of a storm. And it has improved the ability of meteorologists to forecast tornadoes and other severe weather. The lab continues to work on new techniques and instruments including the polarimetric Doppler radar, and the phased array radar, which will provide even better capabilities.
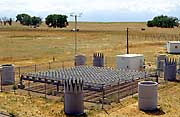
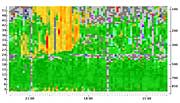
Wind Profilers
The Environmental Technology Laboratory (ETL) and Aeronomy Laboratory (AL), now part of the Earth System Research Laboratory (ESRL) in Boulder, CO, used the Doppler technology to develop another instrument called a wind profiler, a radar that is pointed vertically and provides continuous measurements of upper level winds. The development of this instrument was the first major advance in upper-air measurements since the weather balloon was introduced in the late 1930s. In 1986, the Forecast Systems Laboratory (now ESRL) took the concept of a single wind profiler and recognized that a group of these profilers would provide enormous benefits to the public. In 1992, FSL completed the installation of a network of wind profilers throughout the midwestern United States and Alaska. Later, at each site, they added the ability to measure temperature using a radio acoustic sounding system (RASS) and water vapor using a GPS system. Begun as a research demonstration project, the NOAA Profiler Network (NPN) has been providing critical operational data to the National Weather Service since its inception. As part of ESRL’s mission of technology transfer, the network is now being transferred to the NWS.
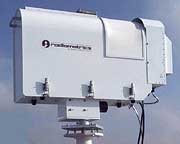
GPS Water Vapor Demonstration Network
The Earth System Research Laboratory also operates and maintains a Ground-Based GPS Water Vapor Demonstration Network, currently consisting of nearly 300 sites located in the contiguous 48 states and Alaska. Water vapor is one of the most important elements of the atmosphere. It’s the way moisture and latent heat are carried to the atmosphere to cause weather. It also plays a critical role in the global climate system. An important goal in modern weather prediction is the improvement of short-term cloud and precipitation forecasts, but in order to achieve this goal, accurate water vapor data is needed. Since the inception of the GPS Water Vapor Demonstration Network, the situation has greatly improved.
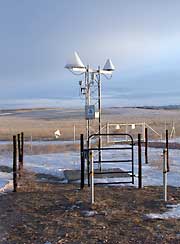
Ground Observing Stations (Mesonets)
In the last several years, there has been a tremendous expansion in the number of automated weather stations, and groups of weather stations (mesonets), particularly outside of NOAA, operating across the United States. The expansion reflects the need by many organizations for frequent, densely spaced, real-time surface observations. Sectors requiring this information include: agriculture, energy, transportation, emergency management, fire management, and meteorological research and education. To fill these needs, many state and local government agencies, public utility companies, research organizations, educational institutes, and private industries have installed surface observing systems.
The Earth System Research Laboratory developed a program, the Meteorological Assimilation Data Ingest System, or MADIS that provides ingest, integration, automated quality control (QC), and distribution support for both NOAA and non-NOAA surface observations. Raw data files are received from various data providers in many different data formats, containing observations from stations that report in various time zones. MADIS ingests these data files, combines the observations from non-NOAA data providers, and integrates them with NOAA data sets by encoding all of the data into a uniform format and converting all of the observations to standard observation units and time stamps.
MADIS will also contribute to the development of a national transportation mesonet consisting of integrated data from State Departments of Transportation (DOTs) as an integral part of the NOAA/Federal Highway Administration surface transportation partnership. Along the nation's highways, there are over 2,000 Environmental Sensor Stations (ESS) [pdf] installed and operated by State Departments of Transportation (DOT). Of these stations, more than 1,400 are field components of Road Weather Information Systems (RWIS). Environmental Sensor Stations (ESS) measure meteorological variables such as pressure, temperature, and winds; road variables such as pavement temperature and road condition, and/or hydrological variables such as stream levels and tides.
A recent draft report, AMS Forum on Weather and Highways, prepared by the American Meteorological Society, stated that "it has been clearly demonstrated that RWIS does benefit highway maintenance operations" and recommends that "the infrastructure be designed to ensure that [RWIS] data are collected on a national level and made available centrally."
|
NOAA Research programs that
develop Weather Observing Systems
![]() Earth
System Research Laboratory (ESRL)
Earth
System Research Laboratory (ESRL)
![]() National Severe Storms Laboratory (NSSL)
National Severe Storms Laboratory (NSSL)
Additional Related Information
AMS Forum on Weather and Highways [pdf]
Water vapor in the global climate system