Racial and Ethnic Differences in Self-Rated Health Status Among Adults With and Without Disabilities
Strategies to reduce racial health inequalities must improve the health and well-being of people with disabilities as well.
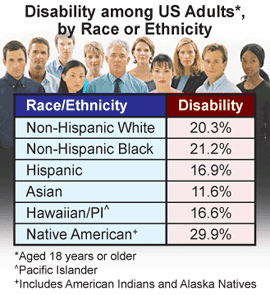
The prevalence (the number of existing disease cases in a defined group of people during a specific time period) of disability among U.S. adults ranged from 11.6% among Asians to 29.9% among American Indians and Alaska Natives (AI/ANs). Within each racial/ethnic population, adults with a disability were more likely to report fair or poor health than adults without a disability, with differences ranging from 16.8 percentage points among Asians to 37.9 percentage points among AI/ANs.
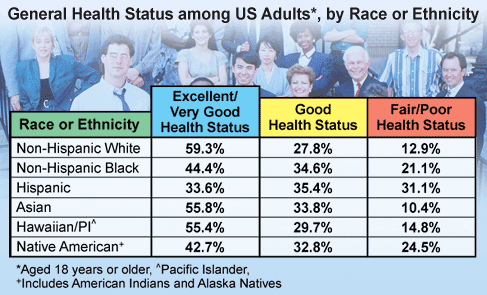
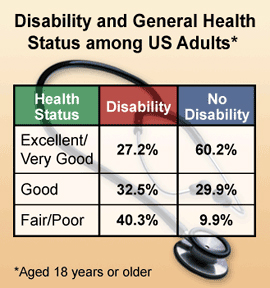
Overall, adults with a disability were less likely to report excellent or very good health and more likely to report fair or poor health (40.3% versus 9.9%), compared with adults without disability (Table 2). White adults without a disability had the highest proportion of respondents who rated their health as very good or excellent (66.9%), whereas 49.9% of black respondents without a disability reported very good or excellent health. Reports of fair or poor health among adults with a disability were most common among Hispanics and AI/ANs (55.2% and 50.5%, respectively) and least common among Asians (24.9%).
BRFSS is a state-based, random-digit–dialed telephone survey of the noninstitutionalized, U.S. civilian population 18 years and older. In 2004, 2005, and 2006, approximately 1 million persons from all 50 states, the District of Columbia, Puerto Rico, and the U.S. Virgin Islands participated in the BRFSS survey.* Consistent with the definition of disability from Healthy People 2010, respondents were asked, "Are you limited in any way in any activities because of physical, mental, or emotional problems?" and "Do you now have any health problem that requires you to use special equipment, such as a cane, a wheelchair, a special bed, or a special telephone?" Participants who responded "yes" to either question were classified as having a disability. To assess self-rated health status, participants were asked, "Would you say that in general your health is excellent, very good, good, fair, or poor?"
DATA SOURCE: Racial/Ethnic Disparities in Self-Rated Health Status among Adults with and Without Disabilities — United States, 2004–2006. MMWR 2008:57(39);1069-1073.