| IV.
Assessing the Adequacy of Future Supply

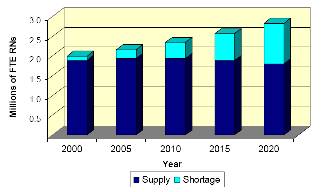
Comparing
the baseline supply and demand projections
suggests that the U.S. had a shortage
of approximately 168,000 FTE RNs in 2003,
implying that the current supply would
have to increase by 9 percent to meet
estimated demand. By 2020 the national
shortage is projected to increase to more
than 1 million FTE RNs (Exhibit 23), if
current trends continue, suggesting that
only 64 percent of projected demand will
be met (Exhibit 24).
The
supply and demand projections most likely
bound the range of the actual number of
FTE RNs who will be employed over the
projection horizon. As the nursing shortage
becomes more severe, market and political
forces will create pressures that will
increase supply, decrease demand, or both.
As
illustrated in the appendix, State-level
shortages will vary substantially over
time and across States. As the nurse shortage
in any particular State becomes too severe,
market forces will create financial incentives
for nurses to migrate to States with more
severe shortages.
Exhibit
23. Projected U.S. FTE RN Shortages, 2000
to 2020
Exhibit
24. Projected U.S. FTE RN Supply, Demand,
and Shortages
|
|
2000 |
2005 |
2010 |
2015 |
2020 |
|
Supply |
1,890,700 |
1,942,500 |
1,941,200 |
1,886,100 |
1,808,000 |
|
Demand |
2,001,500 |
2,161,300 |
2,347,000 |
2,569,800 |
2,824,900 |
|
Shortage |
(110,800) |
(218,800) |
(405,800) |
(683,700) |
(1,016,900) |
|
Supply
÷ Demand |
94% |
90% |
83% |
73% |
64% |
|
Demand
Shortfall |
6% |
10% |
17% |
27% |
36% |
|