


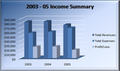
Adding a colorful chart or graph to your spreadsheet can be a quick way of making it more visually appealing.
It can also be used to summarize information or to draw attention to trends and patterns in your data that might otherwise be difficult to see.
A Hi-Lo-Close Chart is one of several stock market charts available in Excel 2007. In general, stock market charts are used to show changes in stock market prices over a given period of time. In particular, a Hi-Lo-Close Chart shows the daily high, low, and closing price for a stock.
To find more about this type of chart, read the step by step tutorial on creating an Excel 2007 Hi-Lo-Close Chart.
Related Articles
Must Reads
Browse Topic
Excel 2007 COUNTIF Function

One of Excel's Count Functions
The COUNTIF function can be used to count up the number of cells in a selected range that meet certain criteria.
Other COUNT Functions
Excel's Go To Feature
The Go To feature in Excel can be used to quickly navigate to different cells in a spreadsheet. Although not necessary for small worksheets, for larger ones it can be useful to have easy ways of jumping from one area to another.
Other Keyboard Shortcuts
Ted's Spreadsheets Blog
Excel 2007 Hi-Lo-Close Chart
Friday January 16, 2009
Excel 2007 SUMIFS Function
Wednesday January 14, 2009
Excel 2007's SUMIFS function is similar to the SUMIF function except that it is used to add up data only if specific criteria are met in two or more ranges of cells.
For example, the function can be used to pick out data for specific years - allowing you, for example, to add up only the profits for the year 2006 and 2007 from a worksheet containing data from 2004 to 2008.
To find out the details, read the article on using the Excel 2007 SUMIFS Function.
Related Articles
Excel 2007 SUMIF
Monday January 12, 2009
Two of the most useful functions available in Excel are the IF function and the SUM function:
SUMIF makes it easier to add up values if a certain criterion is met. The criterion can test the data to be summed or an entirely different range of data.
To find out more, read the short article on the Excel 2007 SUMIF function.
Related Articles
- The IF function introduces decision making which adds flexibility to your to spreadsheets.
- The SUM function makes it easy to add up data located in rows or columns.
SUMIF makes it easier to add up values if a certain criterion is met. The criterion can test the data to be summed or an entirely different range of data.
To find out more, read the short article on the Excel 2007 SUMIF function.
Related Articles
Excel 2007 AVERAGEIF
Friday January 9, 2009
One of Excel's Something - If functions is the AVERAGE IF function.
AVERAGE IF combines two very useful and well used functions - the IF function and the AVERAGE function.
The IF function introduces decision making to your spreadsheets. The AVERAGE function is used to find the average value in a range of data.
AVERAGE IF makes it easier to find the average value if specific criteria are met. This makes it possible to set up trigger cells in a spreadsheet so that the data is averaged only when a certain level is reached.
To find out more, read the short article on the Excel 2007 AVERAGEIF function.
Related Articles
Discuss
Recent Blog Posts
Community Forum
Explore Spreadsheets
Must Reads
More from About.com
Super Bowl XLIII
From the field to the party, weÕve got you covered.Parenting Tips
Keep kids involved and help them succeed.48 Hours in Vegas
Win a weekend getaway in Sin City!Financial Planning
Stay on top with our smart financial tips.
©2009 About.com, a part of The New York Times Company.
All rights reserved.