|
|
|
|
|
Mr. Chairman and Members of the Committee, thank you for inviting me
to discuss the role of health maintenance organizations (HMOs) in Medicare.
Although the Congressional Budget Office (CBO) has recently reduced its
projections of spending for Medicare, the program's costs are still growing
at rates that contribute substantially to the deficit in the short term
and are unsustainable in the long run. At the same time, CBO projects that
enrollment in Medicare HMOs will continue to increase substantially. Those
two projections naturally prompt the question: can risk-based health plans
become the foundation for a sustainable Medicare program?
PROJECTIONS OF MEDICARE SPENDING
CBO projects that spending for Medicare--primarily for medical benefits--will
increase from $194 billion in 1996 to $317 billion in 2002 and $469 billion
by 2007, an average annual increase of more than 8 percent. Although growth
in Medicare has slowed since the late 1980s and early 1990s, it will continue
to outpace the growth in resources that finance the program (see Table
1). CBO projects that federal revenues will grow by only 5 percent a year--about
the same rate as the economy.
|
TABLE 1. PROJECTIONS OF MEDICARE OUTLAYS (By fiscal year, in billions of dollars) |
||||||||||||||
| 1996 | 1997 | 1998 | 1999 | 2000 | 2001 | 2002 | 2003 | 2004 | 2005 | 2006 | 2007 | Average
Annual Rate of Growth, 1996-2007 (Percent) |
||
|
|
||||||||||||||
| Hospital Insurancea | 125 | 137 | 149 | 161 | 176 | 184 | 202 | 218 | 235 | 259 | 275 | 290 | 7.9 | |
| Supplementary Medical Insurancea | 69 | 75 | 82 | 90 | 100 | 105 | 116 | 126 | 138 | 155 | 167 | 179 | 9.1 | |
| Gross Medicare Outlaysa | 194 | 212 | 230 | 251 | 276 | 289 | 317 | 343 | 372 | 414 | 442 | 469 | 8.3 | |
| Premium Receipts | -20 | -20 | -21 | -22 | -23 | -24 | -26 | -27 | -28 | -29 | -31 | -32 | 4.4 | |
| Net Medicare Outlaysa | 174 | 192 | 209 | 229 | 253 | 265 | 292 | 316 | 344 | 385 | 411 | 436 | 8.7 | |
|
|
||||||||||||||
| SOURCE: Congressional Budget Office. | ||||||||||||||
| NOTE: Numbers may not add to totals because of rounding. | ||||||||||||||
| a. Includes benefit payments and mandatory and discretionary administrative expenses. | ||||||||||||||
|
|
||||||||||||||
Outlays for Hospital Insurance (HI) benefits will increase more rapidly
than payroll tax revenues, depleting the HI trust fund by the end of 2001
(see Table 2). Moreover, because premiums for the Supplementary Medical
Insurance (SMI) program may increase by no more than the Social Security
cost-of-living adjustment after 1998, the share of costs covered by premiums
will continue to shrink.
|
TABLE 2. BASELINE PROJECTIONS OF THE MEDICARE HOSPITAL INSURANCE TRUST FUND (By fiscal year, in billions of dollars) |
||||||||||||||
| 1996 | 1997 | 1998 | 1999 | 2000 | 2001 | 2002 | 2003 | 2004 | 2005 | 2006 | 2007 | |||
|
|
||||||||||||||
| Outgo | 125 | 137 | 149 | 161 | 177 | 184 | 202 | 217 | 235 | 259 | 275 | 290 | ||
| Income | ||||||||||||||
| Payroll taxesa | 111 | 118 | 122 | 129 | 135 | 142 | 148 | 156 | 163 | 171 | 180 | 189 | ||
| Interest | 10 | 10 | 9 | 7 | 5 | 2 | -1 | -5 | -9 | -15 | -21 | -29 | ||
| Total | 121 | 128 | 131 | 136 | 140 | 144 | 147 | 151 | 154 | 156 | 158 | 160 | ||
| Deficit | -4 | -10 | -18 | -25 | -36 | -41 | -54 | -67 | -81 | -103 | -117 | -130 | ||
| Fund Balanceb | 125 | 116 | 98 | 73 | 36 | -4 | -59 | -126 | -207 | -310 | -426 | -556 | ||
|
|
||||||||||||||
| SOURCE: Congressional Budget Office. | ||||||||||||||
| NOTE: Numbers may not add to totals because of rounding. | ||||||||||||||
| a. Includes a small amount of premiums and other noninterest income. | ||||||||||||||
| b. At the end of the fiscal year. | ||||||||||||||
|
|
||||||||||||||
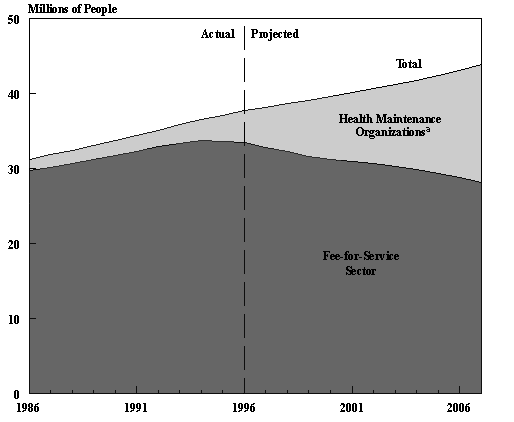
CBO's projections assume that the number of Medicare beneficiaries enrolled
in HMOs will grow rapidly. Although most beneficiaries remain in the traditional
fee-for-service plan, enrollment in risk-based HMOs jumped from 7 percent
of the total in 1995 to 11 percent in early 1997. CBO projects that the
fraction of beneficiaries in such plans will approach 25 percent by 2002
and 35 percent by 2007. With growth in overall enrollment in Medicare rising
very slowly over that period, the number of beneficiaries in Medicare's
fee-for-service sector will decline in absolute terms (see Figure 1).
|
FIGURE 1. MEDICARE ENROLLMENT (By calendar year) |
 |
|
|
| SOURCE: Congressional Budget Office. |
| Includes risk-based plans, other health maintenance organizations, certain demonstrations, and health care prepayment plans. |
|
|
Several factors drive the strong growth in enrollment in risk-based
plans that CBO projects over the next decade. First, because of the rapid
shift in enrollment from fee-for-service to managed care plans in the private
sector, an increasing proportion of people becoming eligible for Medicare
at age 65 will already be HMO members. Second, rising premiums for Medigap
coverage in the fee-for-service sector will make HMO enrollment relatively
more attractive. Third, many employers are dropping or reducing the generosity
of health insurance coverage for retirees.
MEDICARE'S PAYMENTS TO HEALTH MAINTENANCE ORGANIZATIONS
As a result of the rapid increase in HMO enrollment, payments to managed care plans are the fastest growing element of Medicare spending. CBO projects that such payments will increase from $18 billion in 1996 to $73 billion in 2002--a 26 percent average annual rate of growth. In contrast to the private sector, however, where the increasing importance of HMOs and other health care plans has helped to slow the growth in health insurance premiums dramatically, under current Medicare payment policies the program incurs no financial benefit from higher HMO enrollment. In fact, the available evidence suggests that the growth in HMO enrollment actually works to Medicare's disadvantage.
Current Medicare Payment Polices
Medicare's current payment system for risk-based managed care plans is, by design, unrelated to their cost of doing business. Medicare pays risk-based HMOs 95 percent of the adjusted average per capita cost (AAPCC) for each beneficiary. The AAPCC is an estimate of what a similar beneficiary in the fee-for-service sector in the same county would cost the program. That payment mechanism was intended to allow Medicare to claim some of the savings expected from the more efficient practices of HMOs, while permitting any additional savings to be shared between the HMO and its Medicare enrollees.
Risk Selection
The calculation of the AAPCC takes into account a number of characteristics of beneficiaries that influence Medicare's costs: their age, sex, institutional status, Medicaid eligibility, disability status, and whether they have primary health insurance coverage through an employer. Those adjustments for health risk are crude, however, and result in overpayments.
Numerous studies suggest that Medicare's payment formula does not adequately adjust for differences in health status between HMO enrollees and fee-for-service beneficiaries. The Physician Payment Review Commission, for example, has estimated that new HMO enrollees incur below-average Medicare costs in the six months prior to their enrollment and that beneficiaries disenrolling from HMOs have above-average costs in their first six months back in the fee-for-service sector.
The consensus of the literature is that Medicare pays about 5 percent more on behalf of HMO enrollees than it would have paid if they had remained in the fee-for-service sector. One should note, however, that the available analyses are all based on a period when very few Medicare beneficiaries were enrolled in HMOs. The extent of Medicare's overpayment would decline in the future if HMO enrollment becomes more representative of the entire Medicare population.
Regional Variations
Medicare's current payment system also results in large differences in payment rates among the nation's counties. The ratio of the highest AAPCC to the lowest is currently more than 3 to 1. Even adjusting for regional differences in input costs, that ratio is 1½ to 1.
The variation in price-adjusted payment rates stems from regional differences
in patterns of medical practice in Medicare's fee-for-service sector, as
well as from differences in the health status of fee-for-service beneficiaries.
Regional variation in payment rates contributes to differences in the benefits
that HMOs offer to Medicare beneficiaries. HMOs in counties with a high
payment rate are able to offer more generous benefits to enrollees than
HMOs in counties with a low payment rate. Regional differences in benefits
in turn contribute to regional differences in rates of enrollment in HMOs.
ACHIEVING SAVINGS FROM RISK-BASED PLANS
How can Medicare's HMO program be changed to achieve budgetary savings in the short term and help assure Medicare's survival in the longer run? The shift in enrollment toward risk-based HMOs will not slow Medicare spending unless the program can retain some of the savings possible from managed care plans. In the short run, that result could be achieved in a couple of ways.
The simplest alternative would reduce Medicare's payment rate from 95 percent of fee-for-service costs to some lower percentage. That approach would save money for Medicare. However, it would also diminish the attractiveness of HMOs to beneficiaries, because HMOs would be less able to offer their current array of additional benefits. Yet in markets in which both the payment rate and enrollment in HMOs are high, those effects are likely to be small.
Another way of achieving savings is to break the link between payments to HMOs and costs in the fee-for-service sector. As fee-for-service enrollment shrinks, it makes less sense to base updates to HMO payments on fee-for-service spending in an area. One option is to set the rate of growth of risk-based payments so that it equals an external factor, such as the rate of growth of the economy. Lower updates would achieve savings for Medicare, but they would also slow the growth in HMO enrollment.
In the longer run, a market-based strategy offers the most promising approach to slowing the growth of Medicare spending. Such a strategy would be based on a more competitive Medicare market and a defined contribution from the federal government. Although a complete restructuring of Medicare could require years to achieve, practical steps to begin that process could be adopted now. In particular, taking steps to make risk-based plans more widely available to beneficiaries would be conducive to long-term reform, even though those steps would not reduce Medicare spending in the short run.
One easy step would be to overhaul Medicare's enrollment procedures. Although beneficiaries are currently given a list of risk-based plans in their area, no single, reliable source of information compares the features of those plans. Moreover, most beneficiaries are automatically enrolled in fee-for-service Medicare on first gaining eligibility. Instead, Medicare could institute a coordinated open-enrollment process--similar to that of the Federal Employees Health Benefits Program--in which beneficiaries could select from all health plans operating in their area. Beneficiaries would receive uniform information on all plans regarding benefits, costs, and access to providers.
Another possibility would be to reduce the wide disparities in Medicare payments among counties. That move would provide an incentive for risk-based plans to serve areas that now have low payment rates. At the same time, reducing payment rates in some high-cost areas could bring payments more into line with the costs that plans in those areas incur in covering Medicare services.
A third idea would be to expand the array of risk-based plans to include
a larger range of managed care and private fee-for-service options. Beneficiaries
would be better able to find plans that suited their needs if the range
of options was expanded, although doing so would also increase the possibilities
for favorable selection. Offering a wider variety of plans could also raise
a number of regulatory issues, such as solvency requirements, standards
for quality of care, and antitrust considerations.
THE ADMINISTRATION'S PROPOSAL
The Administration's proposal for Medicare managed care plans incorporates several of the foregoing ideas. The Administration would continue to update HMO rates based on changes in fee-for-service spending. However, it would change how those rates are calculated, and it would encourage additional HMO enrollment by expanding the type of plans eligible to participate and changing the regulations governing Medigap insurance.
Payments to Health Maintenance Organizations
The Administration's proposal would modify payments to HMOs in a number of ways. Specifically, it would:
Measures to Encourage Enrollment in Health Maintenance Organizations
The Administration's proposal also contains several features intended to make HMO enrollment more attractive to beneficiaries. It would:
Impact of the Administration's Proposal
The Administration is still working out the details of some of its proposals, and CBO's analysis of the budget is not yet complete. However, we have reached some tentative conclusions about the effects of the Administration's plan.
CBO estimates that the Administration's proposal would not significantly increase or decrease enrollment in managed care plans. Reducing disparities between high- and low-cost areas, using a coordinated enrollment period, and contracting with additional types of plans would tend to expand the managed care program. But enhancing the benefits package in fee-for-service Medicare and reducing HMO payments relative to those in the fee-for-service sector would lead to lower enrollment in managed care plans.
The guarantee of Medigap coverage on disenrollment raises more complex issues. Such a guarantee could encourage HMO enrollment by easing beneficiaries' worries that they might be locked into a plan they did not like. But it would encourage the disenrollment of sicker beneficiaries from HMOs, compounding selection problems and causing Medigap premiums to increase.
CBO is currently estimating the effects of the Administration's proposals on Medicare spending. The estimate of managed care savings depends on both managed care and fee-for-service policies. We anticipate, however, that our estimate of savings in payments to managed care plans will fall short of the $34 billion that the Administration projects.