|
|
| 2005 | 2006 | 2007 | 2008 | |
|---|---|---|---|---|
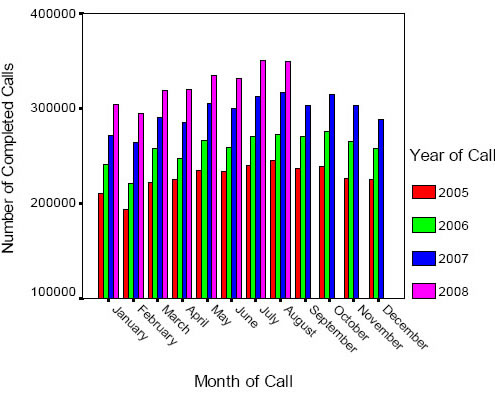
| January | 210,550 | 240,590 | 271,990 | 304,481 |
| February | 193,946 | 221,219 | 264,133 | 294,625 |
| March | 222,026 | 257,921 | 291,094 | 319,458 |
| April | 224,966 | 247,370 | 285,337 | 320,208 |
| May | 234,807 | 266,044 | 305,732 | 335,339 |
| June | 233,564 | 259,576 | 299,685 | 331,987 |
| July | 239,673 | 270,179 | 312,379 | 350,204 |
| August | 245,560 | 273,395 | 316,291 | 349,571 |
| September | 236,432 | 271,164 | 303,495 | Not Available |
| October | 238,423 | 275,720 | 314,710 | Not Available |
| November | 226,445 | 265,331 | 302,581 | Not Available |
| December | 225,077 | 258,172 | 288,829 | Not Available |
There was a significant effect of year on the mean number of monthly completed toll-free calls, F(3, 40) = 69.14, p < .01. More specifically, the average number of monthly completed calls in 2008 (M = 325,734) was significantly higher than those recorded in 2005 (M = 227,662), 2006 (M = 258,890), and 2007 (M = 296,354) according to post hoc comparisons (Table 2).
Table
2
Mean Number of Monthly Completed Toll-free Calls as a Function of Year
| Year | Mean Number of Monthly Calls | Standard Deviation | Number of Months |
|---|---|---|---|
| 2005 | 227,662b | 14,206 | 12 |
| 2006 | 258,890b | 15,820 | 12 |
| 2007 | 296,354b | 16,563 | 12 |
| 2008 | 325,734a | 19,956 | 8 |
Note. Higher means indicate greater completed call volume. Means sharing different subscripts are significantly different at the .05 alpha level. All pairwise comparisons were not conducted on these data. Only comparisons of 2008 data to all other years were of interest in the present analysis.
|