Social Security Benefits – Women
Chart 7b. Percent distribution of women aged 62–64 currently receiving Social Security
benefits, by type of benefit, in December 1984, 1994, and 2004
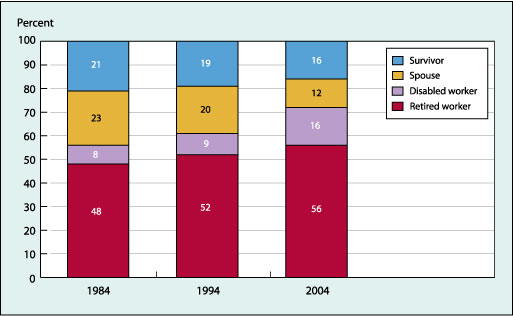
Source: Annual Statistical Supplement to the Social Security Bulletin 1986, 1995, and 2005.
- Over the past two decades, the percentage of current beneficiary
women with earned worker benefits increased. Current beneficiary women with retired
worker benefits increased from 48 percent in 1984 to 56 percent in 2004, while those
with disabled worker benefits doubled from 8 percent to 16 percent.
- Between 1984 and 2004, the percentage of current beneficiary
women receiving spouse benefits decreased from 23 percent to 12 percent, while those
receiving survivor benefits decreased from 21 percent to 16 percent.
- More than 60 percent of women aged 62–64 collected some type
of Social Security benefit in both 1994 (64 percent) and 2004 (63 percent) (Unpublished
analyses of data from the Survey of Income and Program Participation).
Chart 7c. Average monthly retired worker benefits for people aged 62–64 currently
receiving Social Security benefits, in 2004 dollars, by sex, in December 1984, 1994,
and 2004
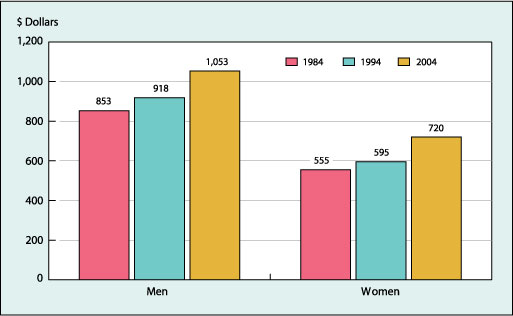
Note: Data for 1984 and 1994 have been inflation adjusted to 2004 dollars.
Source: Annual Statistical Supplement to the Social Security Bulletin 1986, 1995, and 2005.
- Over the past two decades, the average retired worker benefit
increased for both men and women aged 62–64 from $853 to $1,053 (in 2004 dollars)
for men and from $555 to $720 for women.
- The gap between current beneficiary men and women’s average
retired worker benefits (at ages 62–64) decreased slightly between 1984 and 2004
from 54 percent to 46 percent.
- The gap between current beneficiary men and women’s average
retired worker benefits (at ages 62–64) decreased slightly between 1984 and 2004
from 54 percent to 46 percent.
Last Modified: 12/31/1600 7:00:00 PM